# Reports
# User Management Dashboard Report
### **1. Overview**
The **User Management Dashboard Report** helps track user onboarding and login progress across the organization. It provides visibility into registered users, login activity, and pending invitations, with separate views for admins and team owners, enabling
effective monitoring and follow-up actions.
### **2. When to Use**
Use the **User Management Dashboard Report** when you want to:
- Monitor overall user adoption of the platform
- Identify users who are invited but have not logged in
- Track login trends over a selected time period
- Review team-wise or role-wise login performance
- Enable managers, trainers, and mentors to monitor their mapped users
- Take follow-up actions for inactive or non-logged-in users
### **3. Concepts**
- **Registered Users**
Users whose accounts are created and are not blocked.
- **Logged In Users**
Users who have logged into the platform at least once.
- **Not Logged In Users**
Users whose accounts are created but have never logged in.
- **Company Tab**
Admin-level view showing organization-wide data.
- **Team Tab**
View available for Managers, Trainers, and Mentors to see only their mapped users.
- **Invitation Status**:
- *Total Invited*: Users created in the system
- *Accepted*: Users who logged in
- *Not Accepted*: Users who have not logged in
### **4. Set Up Guide**
##### Navigation Path
The User Management Dashboard Report is accessed from the **Reports** section of the platform.
From the Reports area:
- Navigate to **User Management**
- Open the **User Management Dashboard Report**
Based on the logged-in user’s role:
- **Admins** see the **Company tab**
- **Managers, Trainers, and Mentors** see the **Team tab**
- If an admin is also assigned as a manager, trainer, or mentor, both tabs are visible
The report does not require additional configuration. Access is controlled automatically based on role assignments done under **User Setup**.
### **5. User View**
The **User Management Dashboard Report** is displayed based on the user’s role and access level.
- **Admins** Admins can **always view the Company tab**.
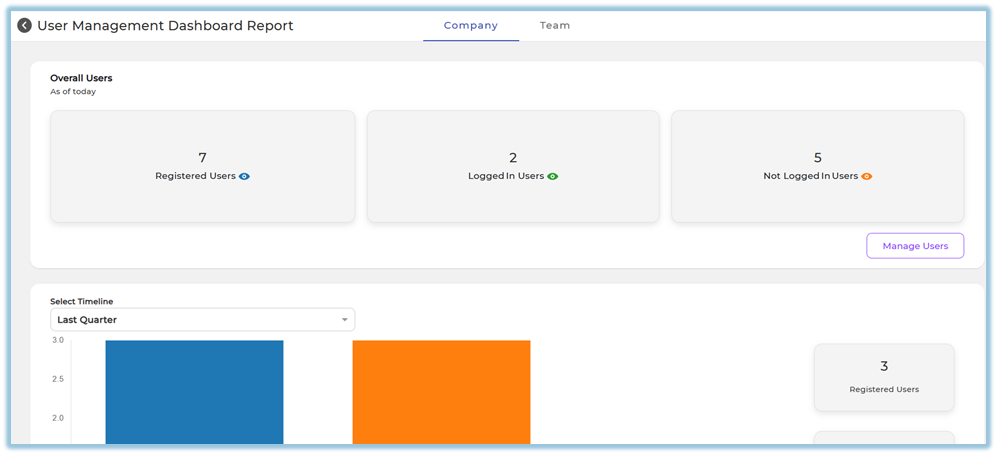
- The **Company tab** shows overall user data for the entire organization, including:
- Registered users
- Logged-in users
- Not logged-in users
- Timeline-based onboarding trends
- User status breakdown by Manager, Trainer, and Mentor
****
- If an **Admin is also assigned as a Manager, Trainer, or Mentor**, then:
- The **Team tab** will also be visible to that admin.
- This allows the admin to view team-specific data in addition to company-wide data.
- **Managers / Trainers / Mentors**
- Can access only the **Team** tab
- Can see data only for their mapped users
- Can download reports for their teams
### **6. Reporting**
The User Management Dashboard Report supports **time-based and mapping-based analysis**.
##### Timeline Analysis
Data can be reviewed across predefined timelines such as:
- This week / Last week
- This month / Last month
- This quarter / Last quarter
- Last 6 months
- Last 12 months
- Custom date range
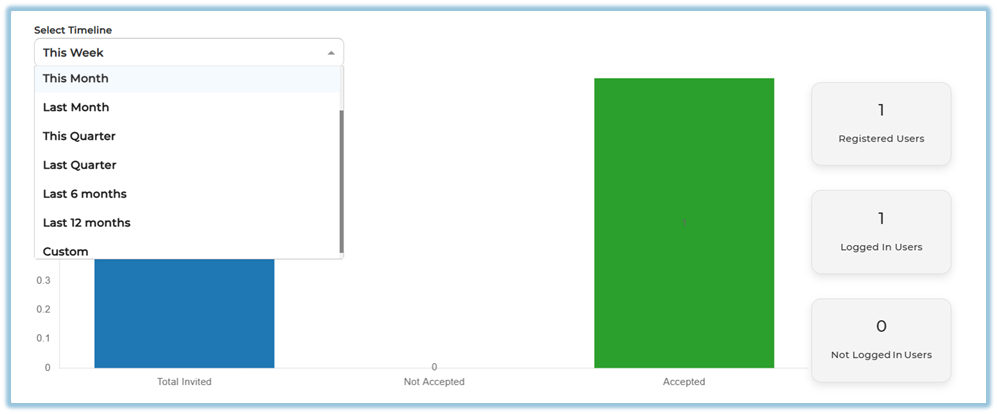
For the selected timeline, the report shows:
- Total Invited users
- Accepted users
- Not Accepted users
- Corresponding user counts on the dashboard
##### Not Logged In Users Analysis
##### Company Tab
- Displays not-logged-in users grouped by:
- Manager
- Trainer
- Mentor
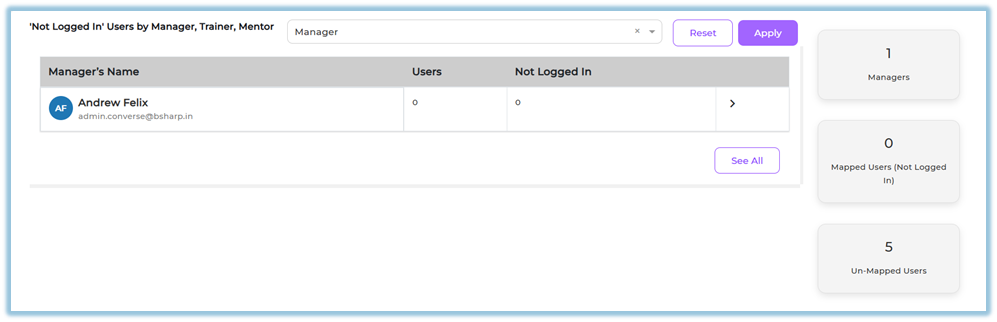
- Shows:
- Total mapped users
- Number of users who have not logged in
- Enables admins to identify ownership gaps and onboarding delays
##### Team Tab
- - Displays **individual user lists
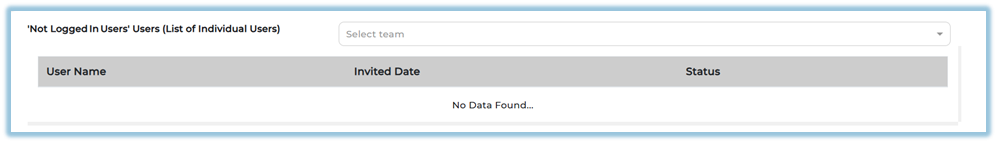**
- Shows:
- User name
- Invitation date
- Login status
- Helps managers, trainers, and mentors take direct follow-up action
### **7. Best Practices**
- Regularly monitor **Not Logged In Users** to improve adoption
- Ensure users are properly mapped to Managers, Trainers, or Mentors
- Use **Custom timeline** for audit or review periods
- Encourage managers to review the **Team tab** frequently
- Follow up early with users who haven’t accepted invites
### **8. Troubleshooting / FAQs**
**Q. Why can’t I see the Team tab?**
Only users assigned as Manager, Trainer, or Mentor can see it.
**Q. Why does the graph show zero values?**
No users were invited or logged in during the selected timeline.
**Q. Why can’t I see certain users?**
Team users see only users mapped to them.
### **9. Related Links**
- [Instant Answers Report](https://help.bsharpcorp.com/books/reports/page/instant-answers-report)
- [Learning of the Day Report](https://help.bsharpcorp.com/books/reports/page/learning-of-the-day-report)
- [Module Completion Reports](https://help.bsharpcorp.com/books/reports/page/modules-completion-report-detailed)
- [Learning Pathway Reports](https://help.bsharpcorp.com/books/reports/page/learning-pathway-master-report)
- [Monthly Activity Report](https://help.bsharpcorp.com/books/reports/page/monthly-activity-report)
### **10. Version Notes**
Last Updated: 30 Dec 2025
# Instant Answers Report
### **1. Overview**
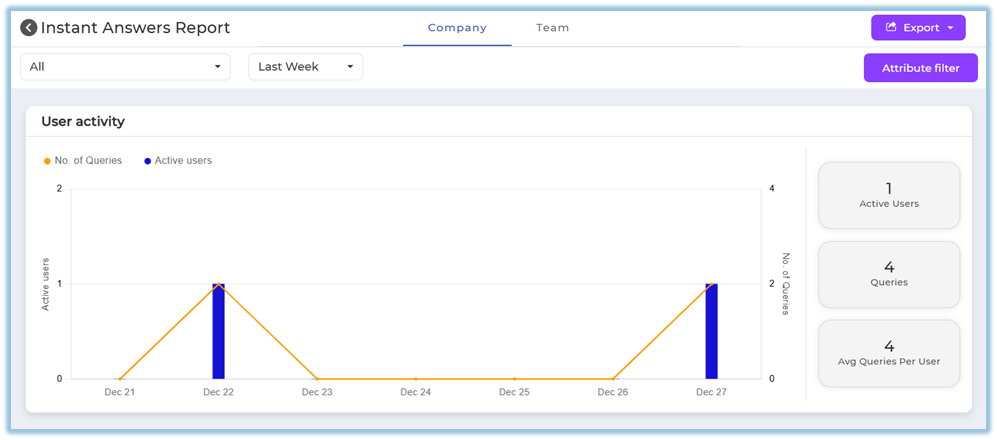
The **Instant Answers Report** provides insights into how users interact with Instant Answers channels across the platform. It helps track user engagement by showing the number of queries raised, active users, and usage trends over a selected period.
The report supports both **organization-level monitoring** and **team-level visibility**, depending on the user’s role and access.
### **2. When to Use**
Use the Instant Answers Report when you want to:
- Monitor overall adoption of Instant Answers across the organization
- Understand how frequently users are raising queries
- Track active users over time
- Analyze usage trends by channel and time period
- Review engagement at a team level for Managers, Trainers, and Mentors
- Export data for analysis and review
### **3. Concepts**
- **Instant Answers Channel**
A configured knowledge channel used by users to raise queries and receive instant responses.
- **Active Users**
Users who have raised at least one query during the selected timeline.
- **Queries**
Total number of questions raised by users in Instant Answers.
- **Average Queries per User**
Average number of queries raised per active user.
- **Company Tab**
Organization-wide view available to Admin users.
- **Team Tab**
Restricted view available only to Managers, Trainers, and Mentors for their mapped users.
- **Attribute Filters**
Filters that allow report data to be refined using user attributes such as designation, department, country, manager, trainer, mentor, etc.
### **4. Set Up Guide**
1. Open the main navigation menu from the homepage.
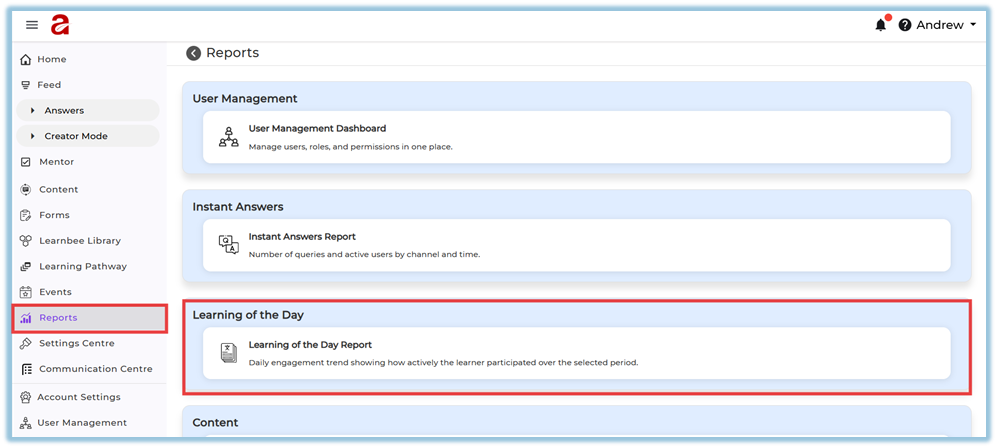
2. Navigate to the **Reports** section.
3. Click on **Instant Answers Report**.
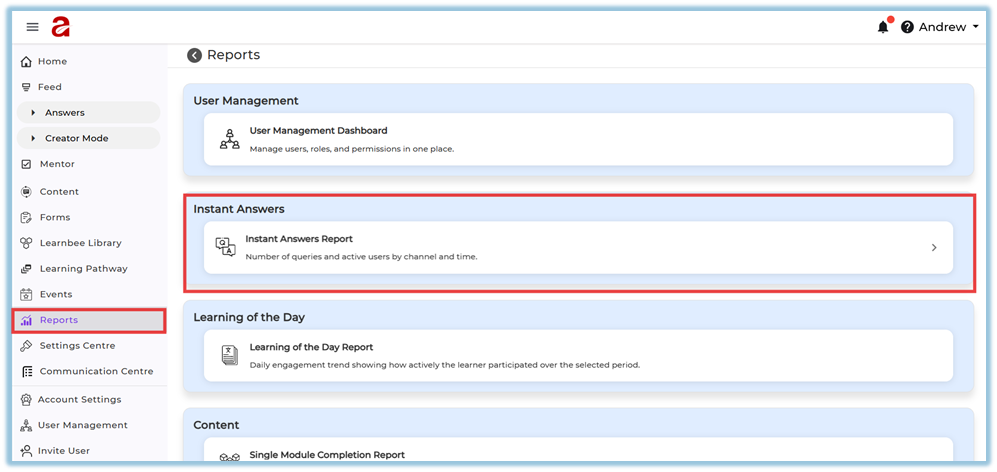
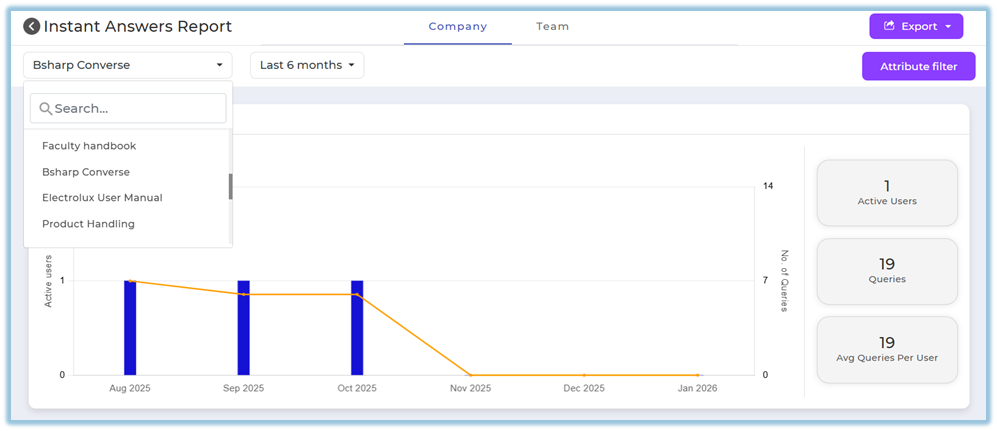
4. View the list of all configured Instant Answers channels displayed in the report.
5. Select a time range such as:
- This week
- Last week
- This month
- Last month
- This quarter
- Last quarter
- Last six months
- Last 12 months
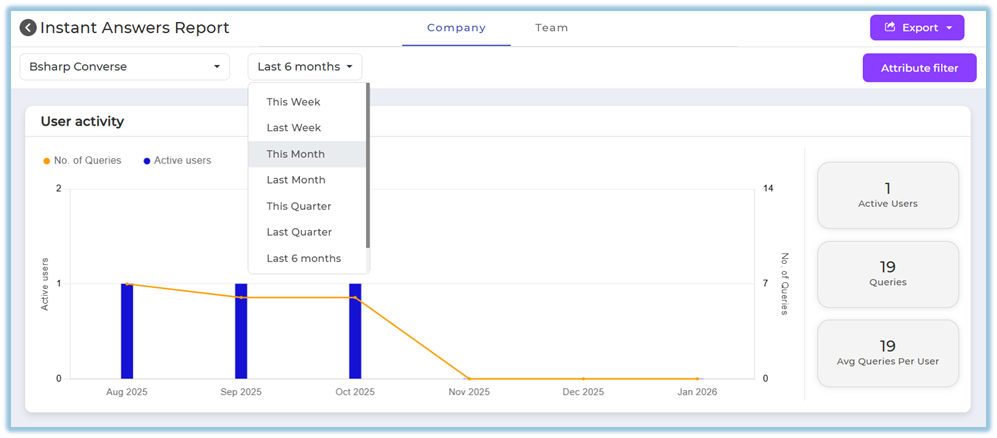
6. Review the dashboard data updated based on the selected time range.
7. Click **Attribute Filter** to refine the report using user attributes such as:
- Designation
- Department
- Country
- Coach email
- Trainer email
- Manager email
- State
- City

8. Select the required attribute values and apply the filter to update the dashboard.
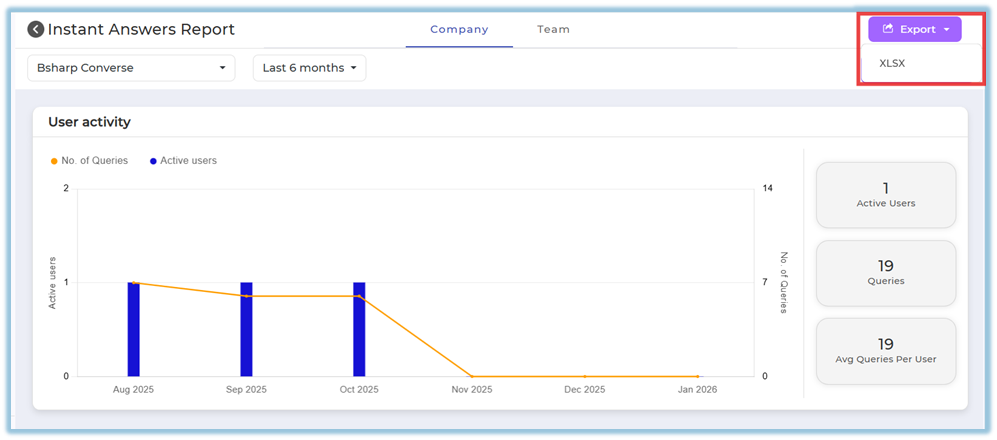
9. Click **Export** to download the filtered report as an Excel file.
### **5. User View**
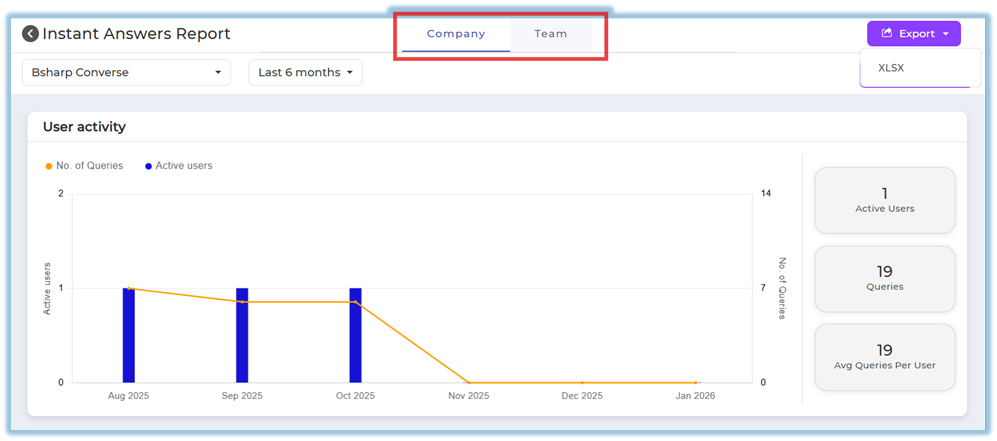
Admins can see only the **Company** tab by default, which displays Instant Answers usage across all users and channels.
If an admin is also assigned as a manager, trainer, or mentor, they can additionally see the **Team** tab.
Managers, trainers, and mentors see the **Team** tab, which displays the same report layout but restricted to their mapped users only.
### **6. Reporting**
- The **Instant Answers Report** displays:
- User activity across Instant Answers channels
- Number of queries raised
- Count of active users
- Data can be filtered by time range and user attributes.
- Reports can be downloaded as Excel files for offline review or sharing.
- The report is accessed via **Reports → Instant Answers Report**.
[https://converse.bsharpcorp.com/celebrate/instant\_answers\_report/-1](https://converse.bsharpcorp.com/celebrate/instant_answers_report/-1)
### **7. Best Practices**
- Apply attribute filters to analyze usage by department or role.
- Use longer time ranges (last quarter or last 12 months) for trend analysis.
- Export reports regularly if historical comparison is required.
- Review both query count and active users together to understand true engagement.
### **8. Related Links / FAQs**
- **Related:** [User Management Dashboard Report](https://help.bsharpcorp.com/books/reports/page/user-management-dashboard-report)
- **Related:** [Learning of the Day Report](https://help.bsharpcorp.com/books/reports/page/learning-of-the-day-report)
**FAQ**
**Who can view the Team tab?**
Only users assigned as managers, trainers, or mentors can view the Team tab.
### **9. Version Notes**
****Last Updated:**** 31 Dec 2025
# Learning of the Day Report
### **1. Overview**
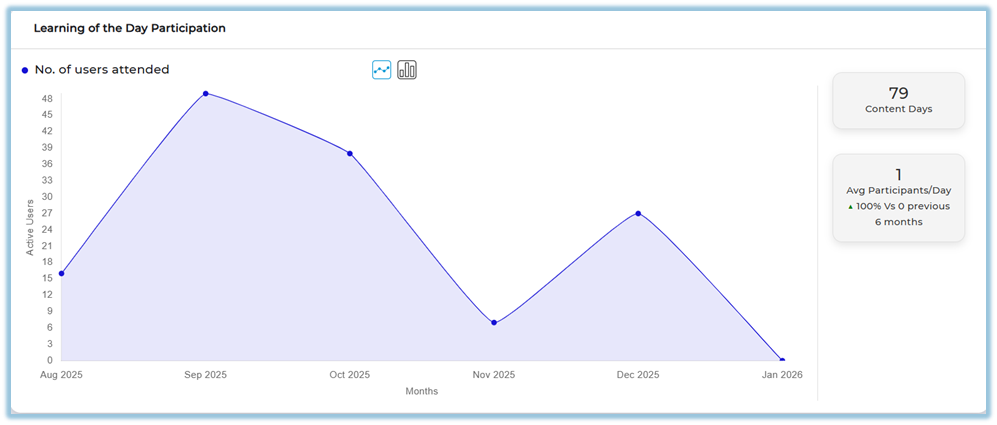
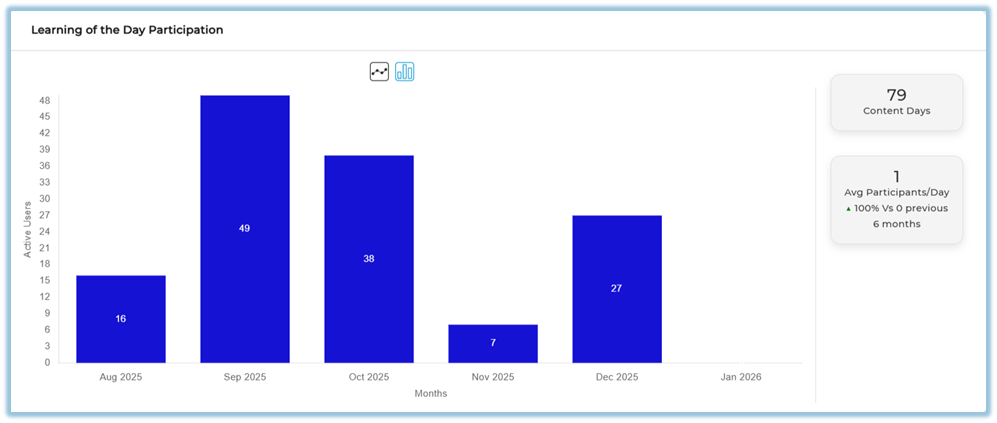
The Learning of the Day Report provides visibility into daily learning participation, knowledge gaps, and knowledge mastery for Learning of the Day topics, with insights available at company, team, and user levels based on access.
### **2. When to Use**
- When you want to understand how users are engaging with Learning of the Day topics.
- When you need to identify knowledge gaps and areas of mastery across learners.
- When managers, trainers, or mentors need visibility into their team’s daily learning trends.
- When individual users want to review their own learning gaps and mastery areas.
### **3. Concepts**
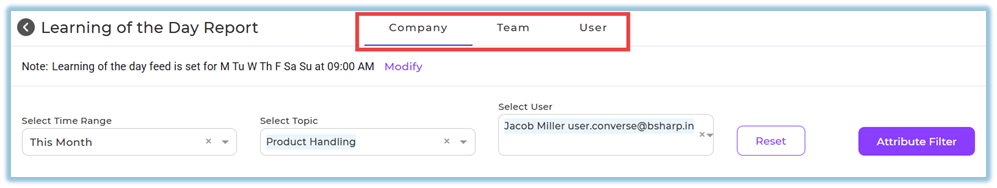
- **Time Range Filter:** Controls the period for which Learning of the Day data is displayed.
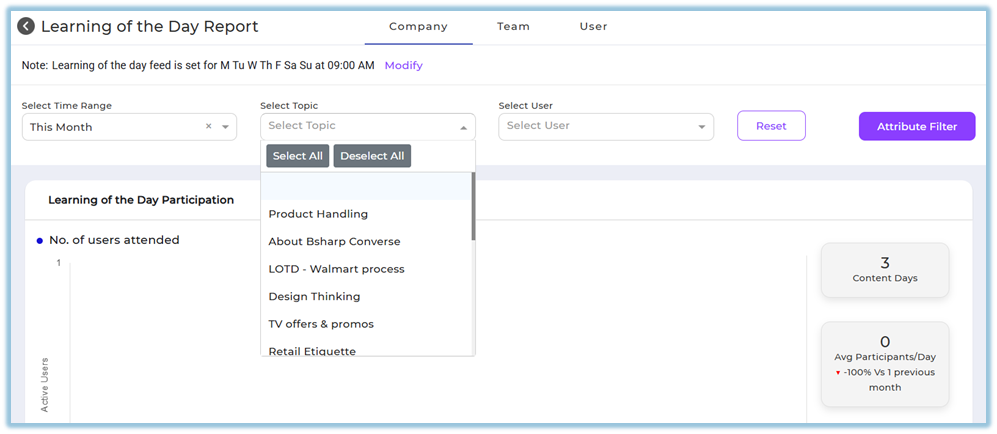
- **Topic Selection:** Filters the report by a specific Learning of the Day topic.
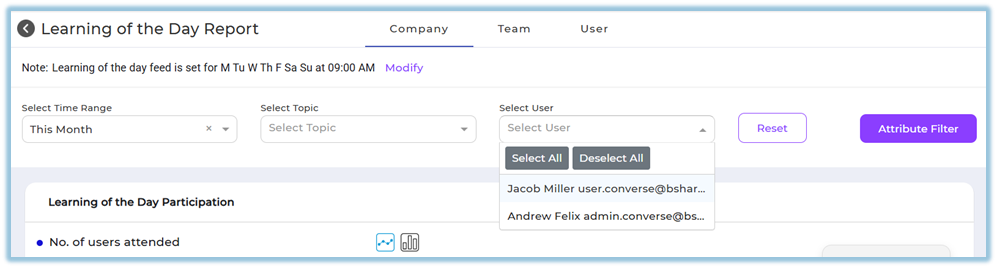
- **User Selection:** Allows viewing data for a specific user where applicable.
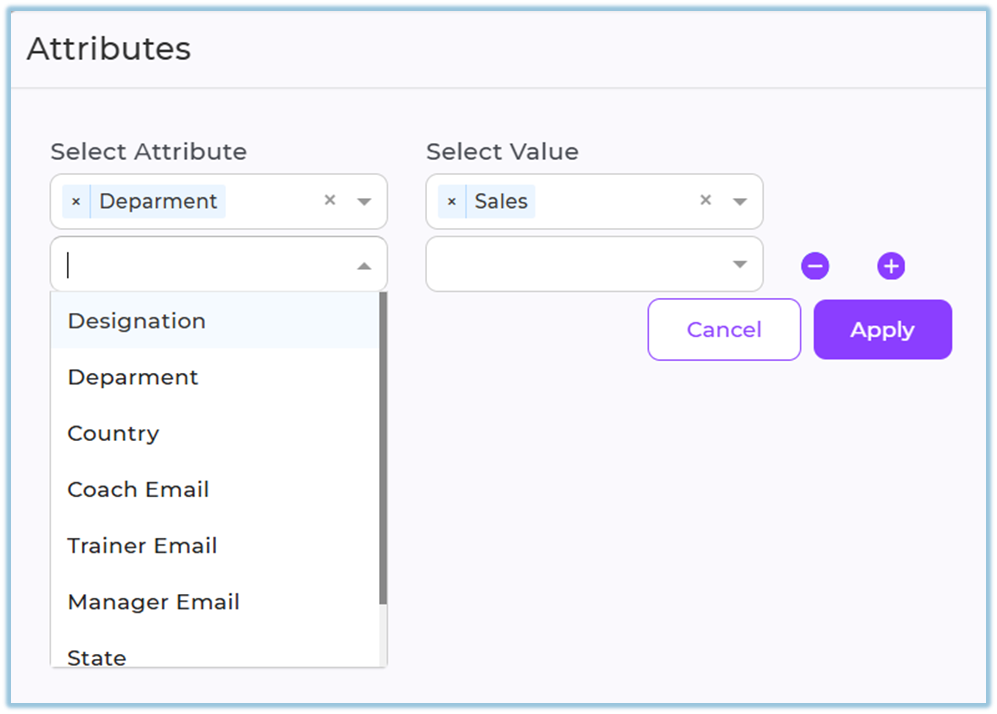
- **Attribute Filter:** Narrows data using attributes such as designation, department, country, coach, trainer, manager, state, or city.
- **Participation Visualization:** Graphical view of Learning of the Day participation trends.
- **Knowledge Gaps:** Identifies topics where learners show low understanding.
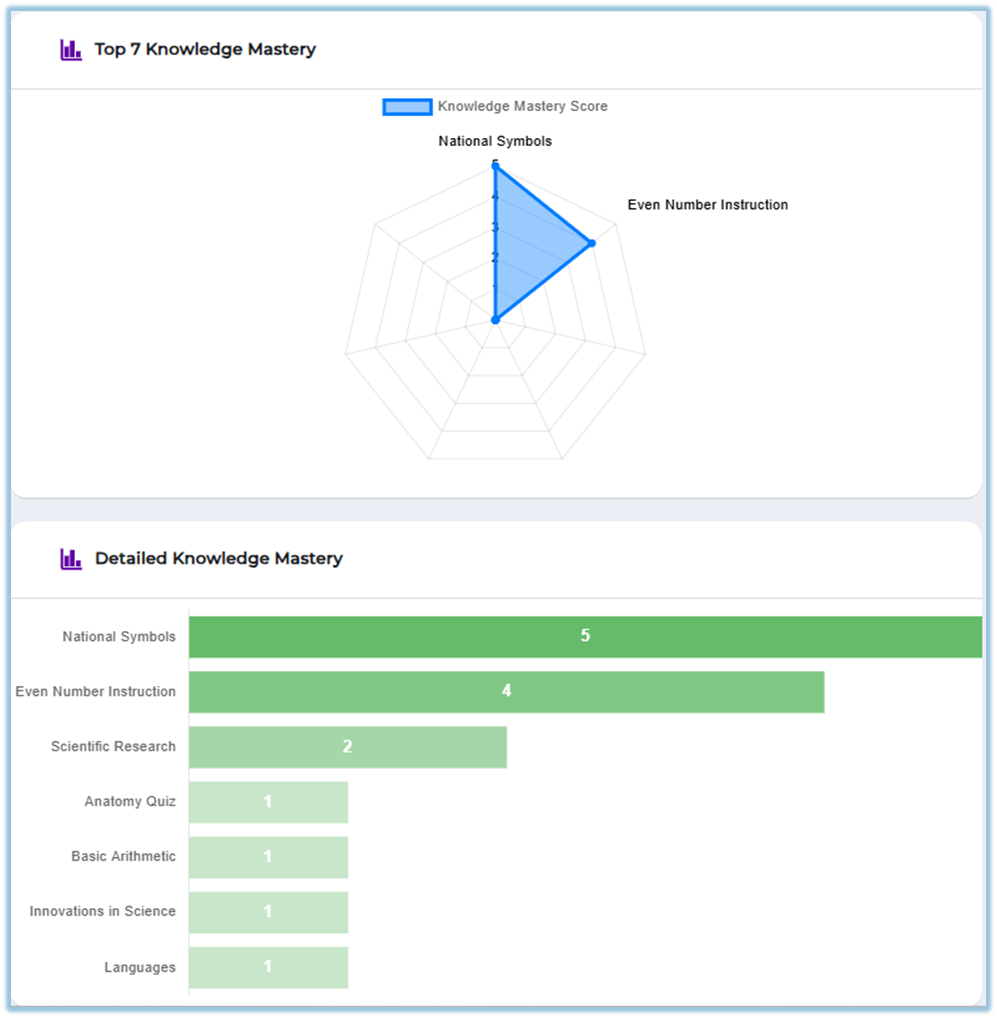
- **Knowledge Mastery:** Identifies topics where learners show strong understanding.
### **4. Set Up Guide**
1. Open the main navigation menu.
2. Navigate to the **Reports** section.
[https://converse.bsharpcorp.com/celebrate/user-report-page](https://converse.bsharpcorp.com/celebrate/user-report-page)
3. Select **Learning of the Day** under Reports.
4. Choose the required time range from the date filter options, including predefined ranges or **Custom** dates.
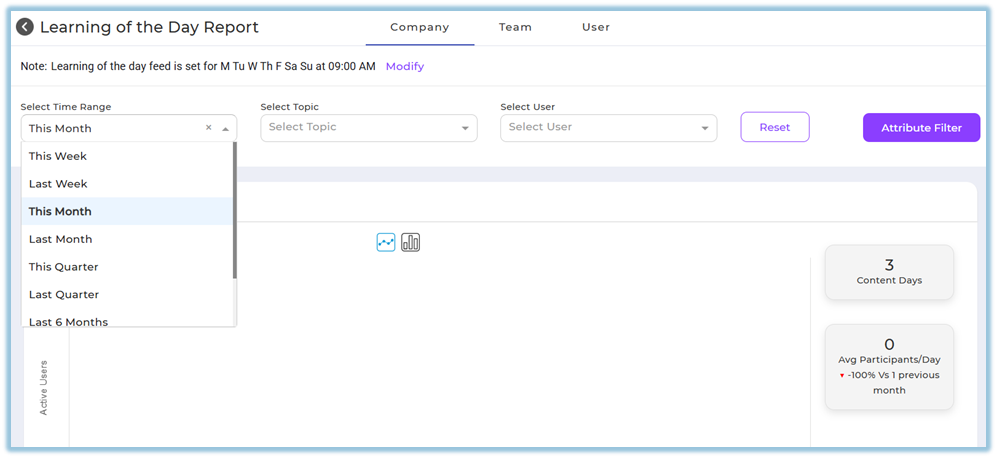
5. Select the required topic to view Learning of the Day data for that topic.
6. Select a specific user if user-level filtering is required.
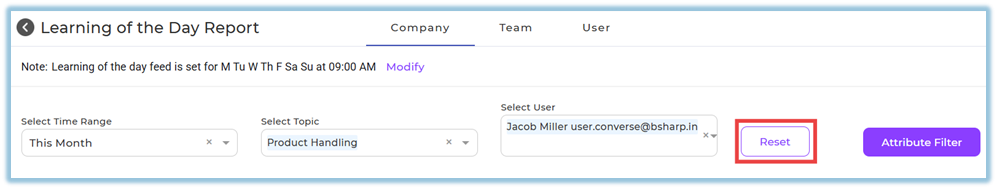
7. Use **Reset** to clear all selected filters and attributes.
8. Select **Attribute Filter** and add filters such as designation, department, country, coach, trainer, manager, state, or city.
9. Click **Apply** to update the report based on selected filters.
### **5. User View**
Admins can view **Company**, **Team**, and **User** tabs based on access.
Managers, trainers, and mentors can view the **Team** tab with the same report structure scoped to their assigned users.
End users can view only the **User** tab, which displays their own Learning of the Day participation, knowledge gaps, and knowledge mastery.
### **6. Reporting**
- **Learning of the Day Report:** Shows participation trends, top knowledge gaps, top knowledge mastery, and detailed views for each.
**Participation Trends:**
**Top Knowledge Gaps:** 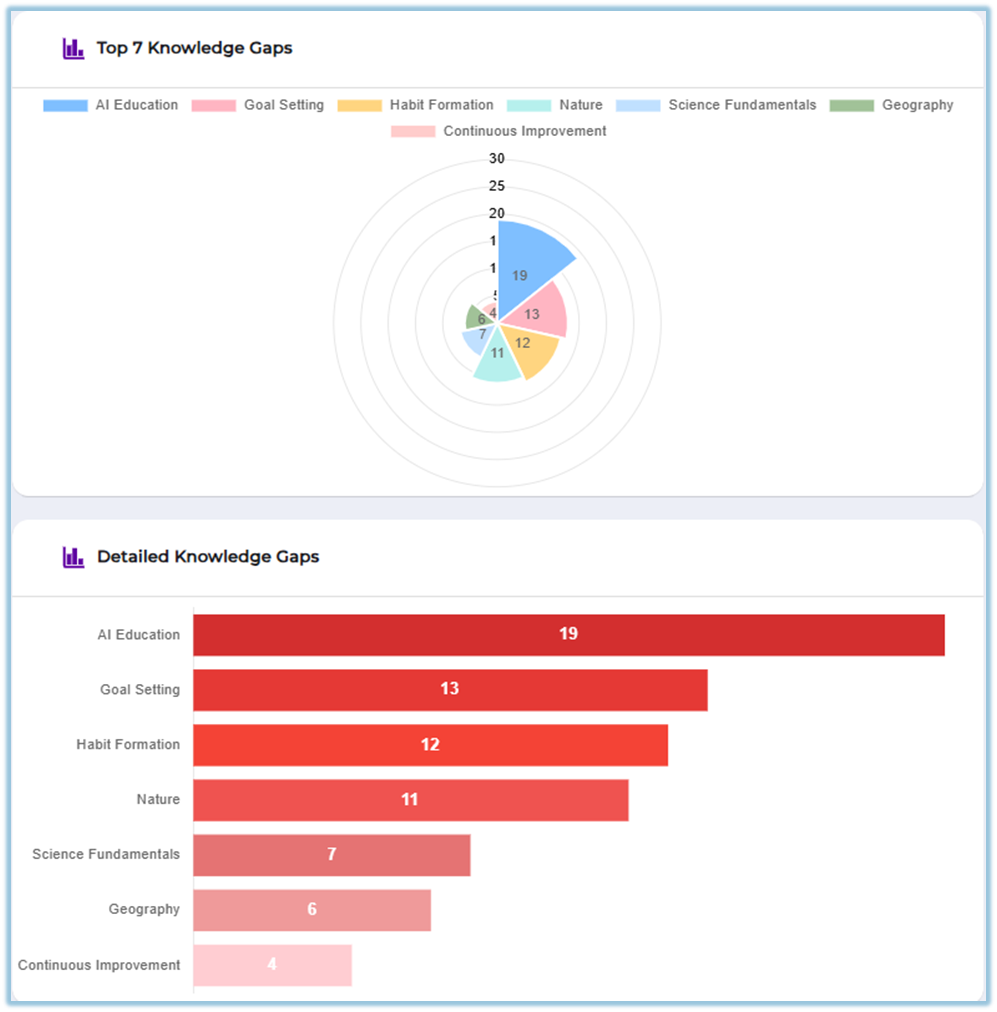
**Top Knowledge Mastery:**
- The report is accessible from **Reports → Learning of the Day**.
[https://converse.bsharpcorp.com/celebrate/lotd-insights](https://converse.bsharpcorp.com/celebrate/lotd-insights)
- The same report structure is available across Company, Team, and User tabs, with access-based visibility.
### **7. Best Practices**
- Use consistent time ranges when comparing participation trends.
- Apply topic filters to focus analysis on specific learning areas.
- Use attribute filters to segment data meaningfully for teams or regions.
- Review both knowledge gaps and mastery sections together for balanced insights.
### **8. Related Links / FAQs**
- **Related:** [User Activity Dashboard](https://help.bsharpcorp.com/books/reports/page/user-activity-dashboard)
- **Related:** [Single Module Completion Report](https://help.bsharpcorp.com/books/reports/page/single-module-completion-report)
**FAQ:**
**Who can see the Team tab?**
Only users assigned as managers, trainers, or mentors can view the Team tab.
### **9. Version Notes**
Last Updated: 31 Dec 2025
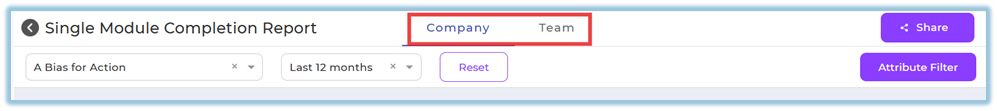
# Single Module Completion Report
### **1. Overview**
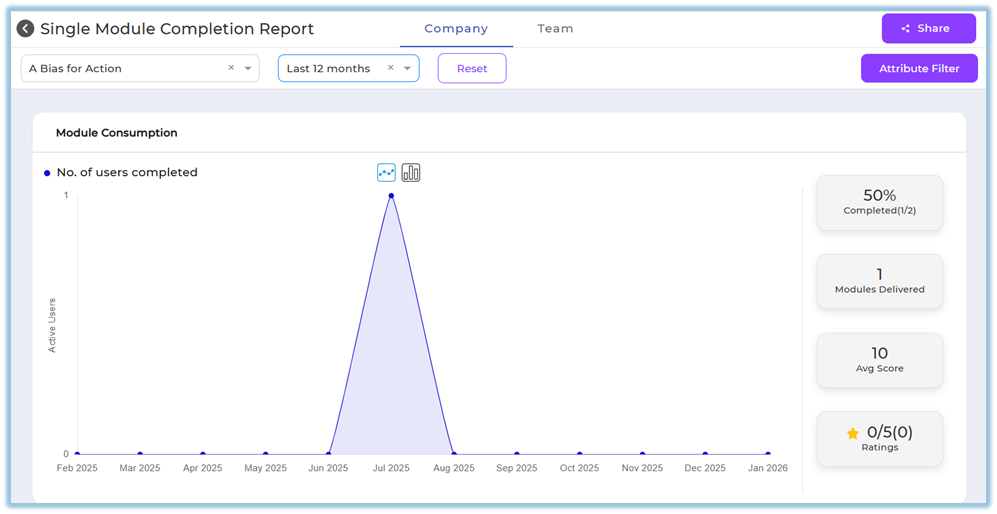
The Single Module Completion Report provides visibility into how users have engaged with and completed a specific module, including completion status, activity trends, scores, ratings, and learning object–level details, with views available at both company and team levels.
### **2. When to Use**
- When you need to track completion progress for a specific module across users.
- When you want to review learner engagement, scores, or ratings for a single module.
- When managers, trainers, or mentors need visibility into their team’s module completion.
- When detailed user-level completion data is required for audits or follow-ups.
### **3. Concepts**
- **Module Selection:** Identifies the specific module for which completion data is displayed.
- **Date Range:** Filters module data based on the selected time period.
- **Company View:** Displays organization-wide module completion data.
- **Team View:** Displays module completion data limited to mapped team users.
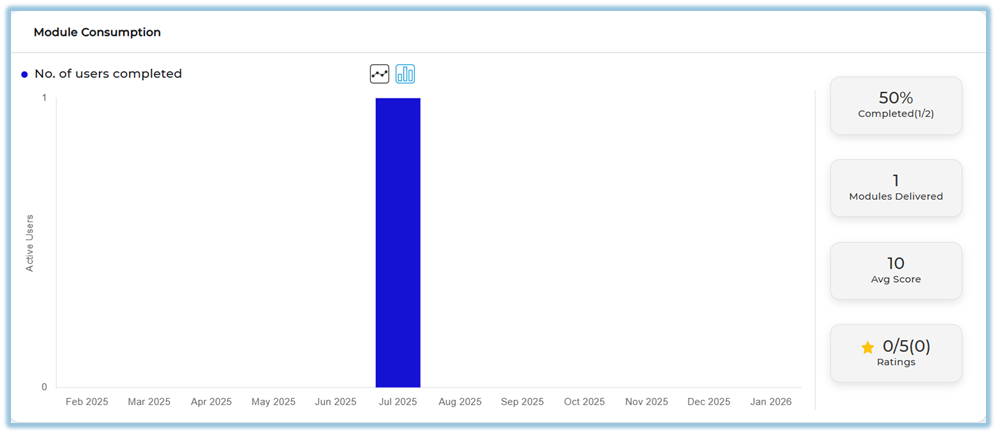
- **Completion Metrics:** Summarized indicators such as completion percentage, modules delivered, average score, and ratings.
- **Completion Visualization:** Graphical representation of active users and completed users.
- **User Completion Status:** User-level completion details for the selected module.
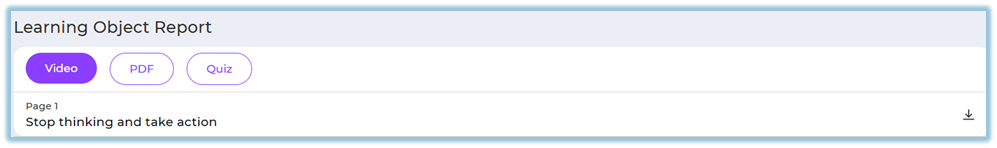
- **Learning Object Report:** Item-level completion data for videos, PDFs, quizzes, or other content within the module.
- **Attribute Filters:** Filters report data using user attributes such as department or manager email.
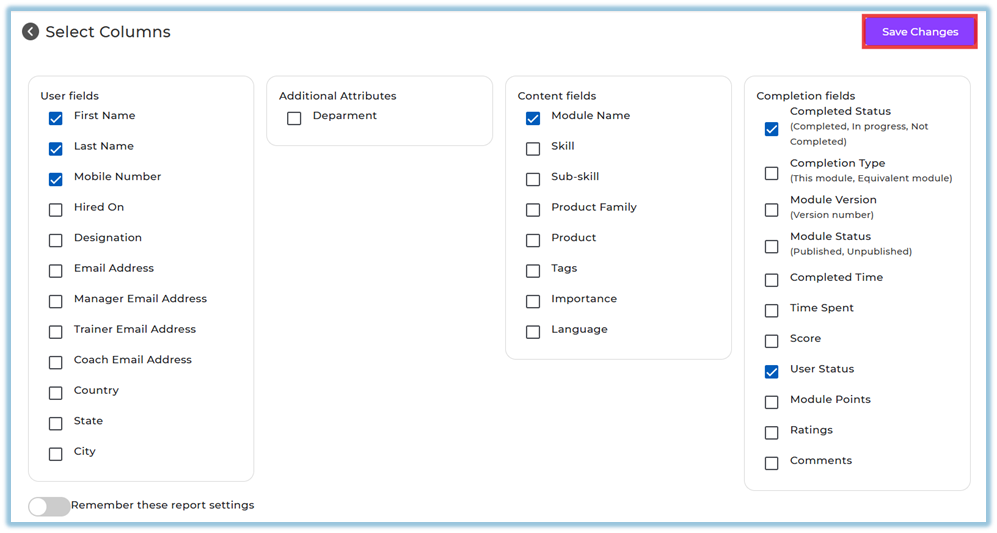
- **Column Selection:** Controls which fields appear in the downloaded report.
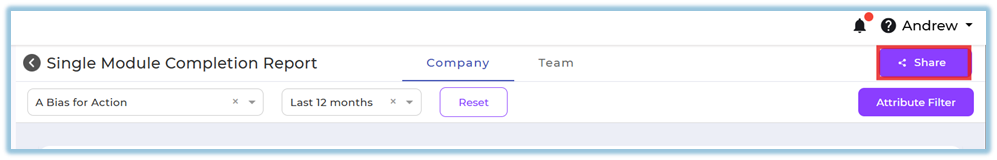
- **Report Sharing:** Allows controlled sharing of report access with selected users.
### **4. Set Up Guide**
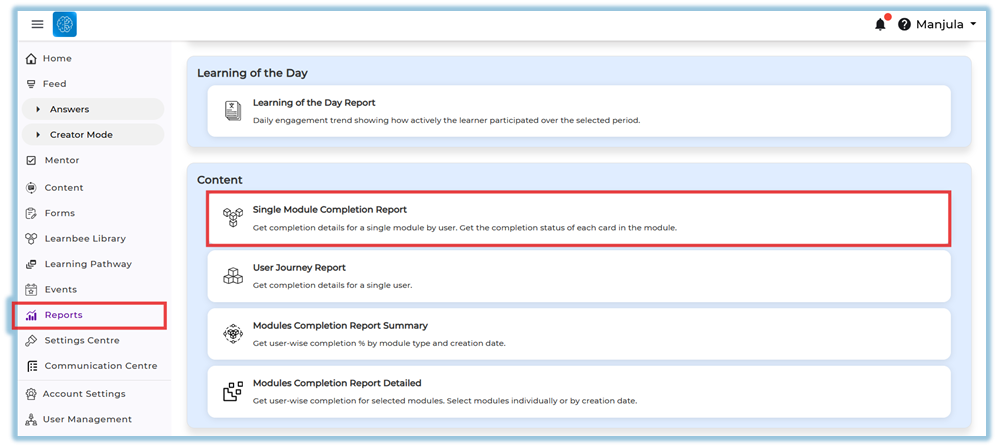
1. Open the **Reports** section from the Mega Bar navigation menu.
2. Navigate to the **Content** section within Reports.
[https://converse.bsharpcorp.com/celebrate/user-report-page](https://converse.bsharpcorp.com/celebrate/user-report-page)
3. Select **Single Module Completion Report** from the list of available reports.
4. Choose the required module using the module selection field.
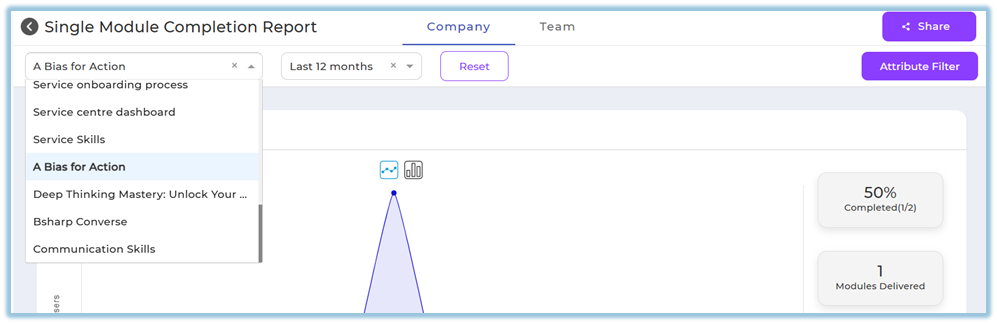
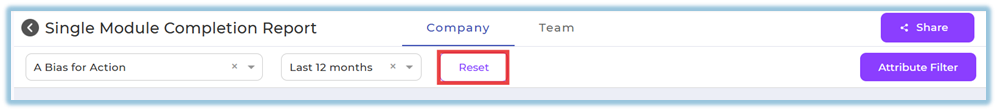
5. Select the appropriate date range using the date filter and use **Reset** if required.
6. Review the completion data displayed under the **Company** tab.
7. Switch to the **Team** tab to view the same report scoped to assigned team users.
8. Use **Attribute Filter** to apply attribute-based filtering if needed.

9. Select **Selected Columns** to customize the fields included in the report output.
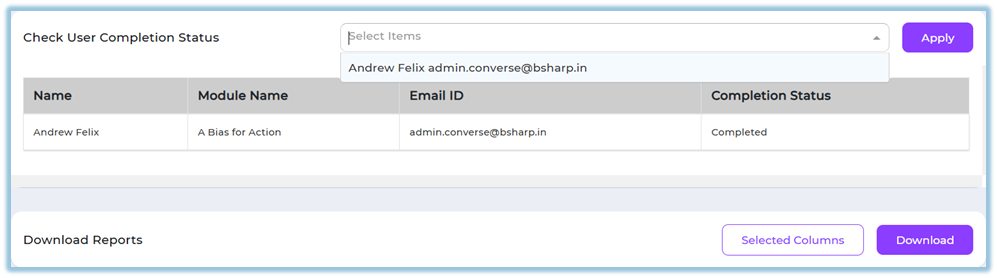
10. Save column selections and download the report as required.
11. Use the **Share** option to share the report with selected users if access is permitted.
### **5. User View**
Users with report access can view module completion summaries, graphical trends, and detailed completion tables. The Company tab is visible to admins, while the Team tab is visible only to users mapped as managers, trainers, or mentors. Users can interact with graphs, view completion status, and access downloadable report data based on permissions.
### **6. Reporting**
- **Single Module Completion Report:** Displays completion status, activity trends, scores, ratings, and learning object details for a selected module.
- **Learning Object Report:** Shows completion data for individual content items such as videos, PDFs, and quizzes within the module.
- Reports can be accessed from **Reports → Content → Single Module Completion Report**.
[https://converse.bsharpcorp.com/celebrate/learning-module-program-page/learning-module-report/-1](https://converse.bsharpcorp.com/celebrate/learning-module-program-page/learning-module-report/-1)
### **7. Best Practices**
- Select a clear and consistent date range when comparing completion trends.
- Use attribute filters to narrow data to relevant user groups.
- Customize report columns before downloading to avoid unnecessary data.
- Use the Team tab for role-based monitoring rather than company-wide analysis.
### **8. Related Links / FAQs**
- **Related:** User Journey Report
- **Related:** Module Completion Report Summary
- **FAQ:** Who can access the Team tab?
- Only users assigned as managers, trainers, or mentors can view the Team tab.
### **9. Version Notes**
Last Updated: 31 Dec 2025
# User Activity Dashboard
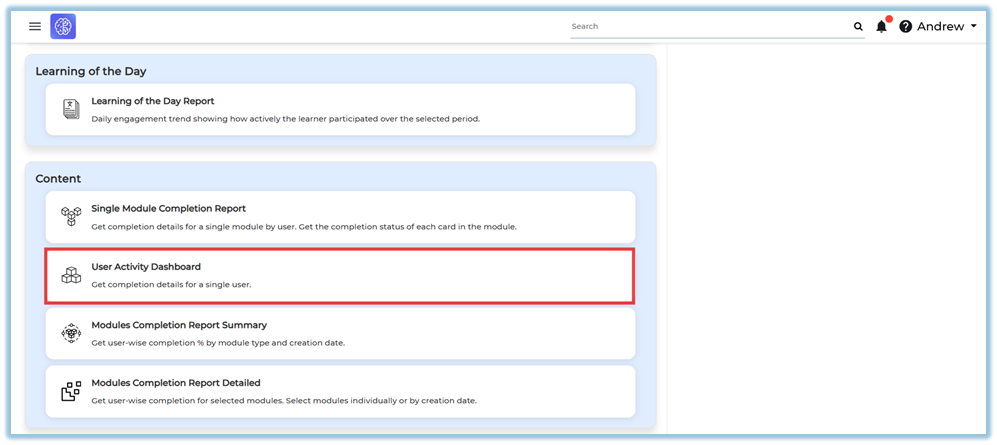
### **1. Overview**
The User Activity Dashboard is a report available under the Reports section that allows administrators to view engagement and learning progress details for a single user over the last six months. It consolidates activity, learning interactions, points earned, module completion, and pathway progress into one dashboard view.

### **2. When to Use**
- When you need to review the learning activity of a specific user over the last six months.
- When you want to understand how actively a user is engaging with different learning features.
- When you need to check module and pathway completion status for an individual user.
- When you want to download user-level learning and activity data.
### **3. Concepts**
- **Reports section** – The area in Converse where all downloadable and viewable reports are available.
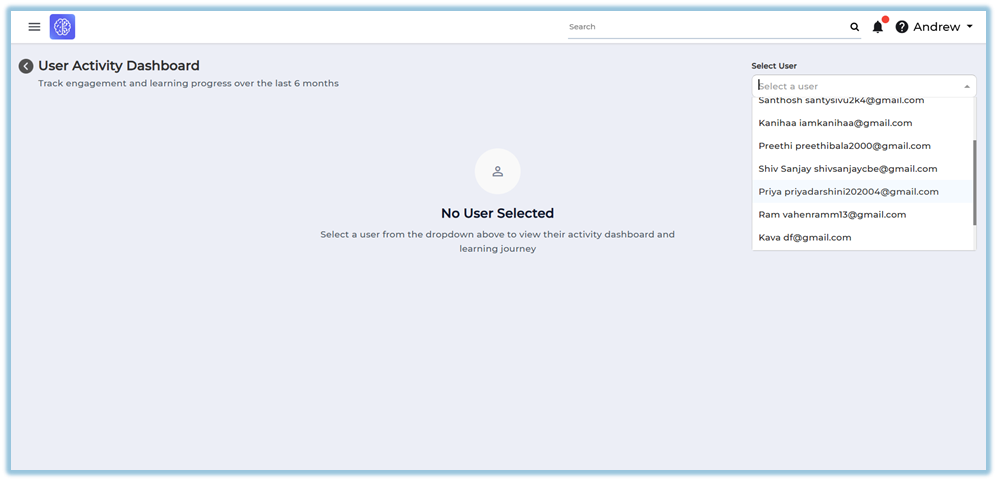
- **User selection** – A dropdown used to choose a single user whose activity data will be displayed.
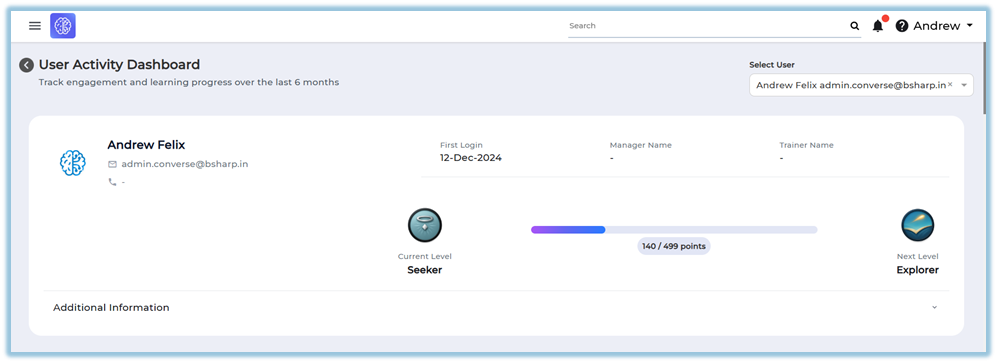
- **User profile details** – Basic information shown for the selected user, including contact and role details.
- **Activity overview** – A summary of the user’s engagement status over the last six months.
- **Activity by feature** – A breakdown of interactions across learning features such as modules and daily learning.
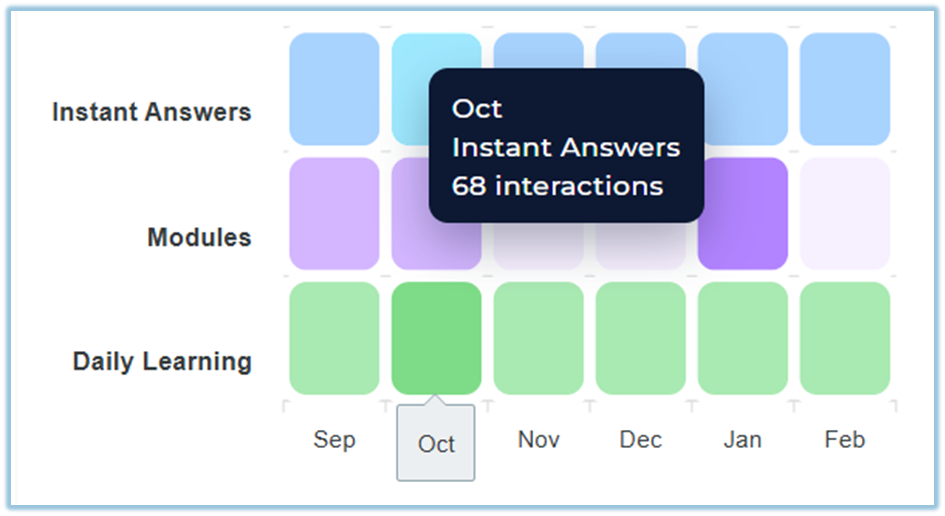
- **Activity heat map** – A visual indicator showing consistency and feature usage intensity over time.
- **Points and rewards** – A summary of points earned by the user during the last six months.
- **Module completion** – Details of completed, in-progress, and not completed learning modules.
- **Pathway completion** – Progress tracking for priority and overall learning pathways assigned to the user.
- **Column customization** – An option to select which data fields appear in downloadable reports.
- **Data download** – The ability to export user activity data for offline review.
### **4. Set Up Guide**
1. Click the three-line main menu from the homepage.
2. Click **Reports** to open the reports landing page.
[https://converse.bsharpcorp.com/celebrate/user-report-page](https://converse.bsharpcorp.com/celebrate/user-report-page)
3. Locate the **Content** section within Reports.
[https://converse.bsharpcorp.com/celebrate/individual\_user\_reports/489](https://converse.bsharpcorp.com/celebrate/individual_user_reports/489)
4. Click **User Activity Dashboard** from the list of available reports.
5. On the right side of the screen, click **Select a user**.
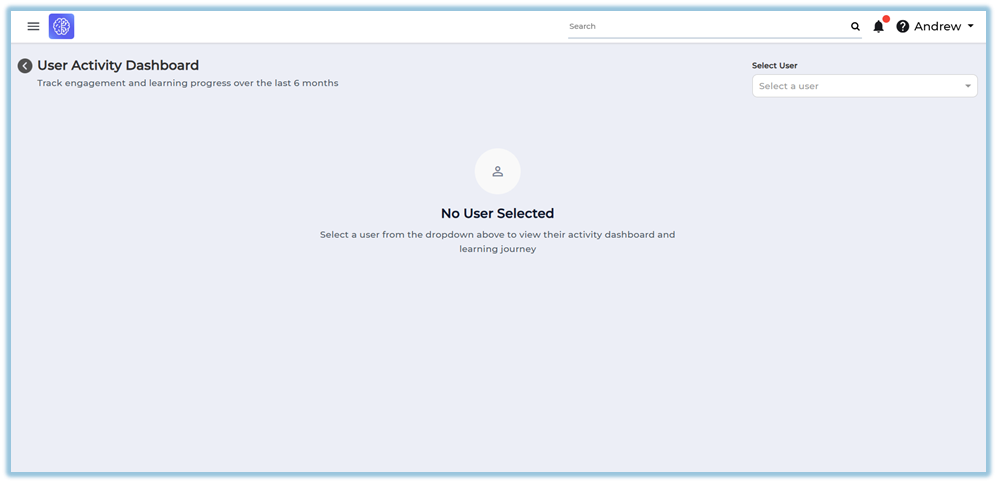
6. Choose a single user from the dropdown list.
7. View the user’s activity status page that appears automatically after user selection.
8. Scroll down to view activity status, feature usage, points, module completion, and pathway completion details.
### **5. User View**
Once a user is selected, the dashboard displays the user’s profile information at the top, including username, email ID, mobile number, first login date, manager, and trainer. Below this, the page shows activity summaries, graphs, tables, and downloadable sections related to the selected user’s learning and engagement.
### **6. Reporting**
**User Activity Dashboard**
- Displays the user’s activity status for the last six months, indicating whether the user is active or inactive.
- **Interactions** represent the **total number of learning tasks completed by the user**.
- A task is counted as an interaction when the user completes an action such as:
- - Completing a **module**
- Completing a **Learning of the Day (LoTD)**
- Using **Instant Answers**
- The interaction count is calculated by **adding all completed tasks across features**.
- Shows a monthly activity indicator highlighting the months in which the user was active.
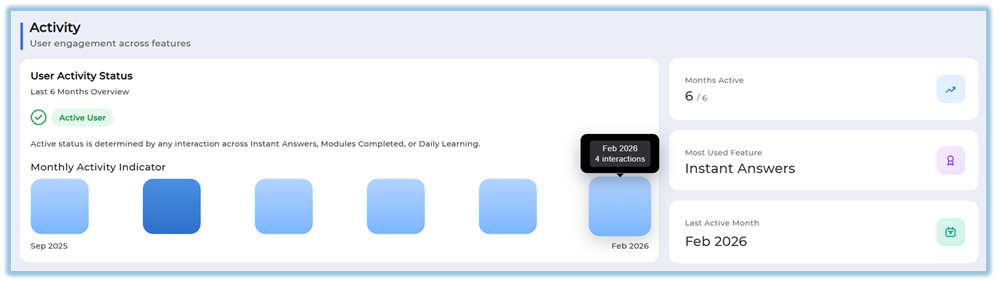
- Displays the most used feature and the user’s last active month.
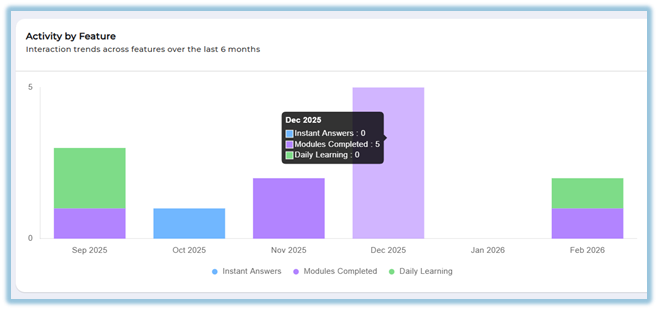
- Provides an **Activity by Feature** section showing interactions across Instant Answers, Modules Completed, Modules, and Daily Learning.
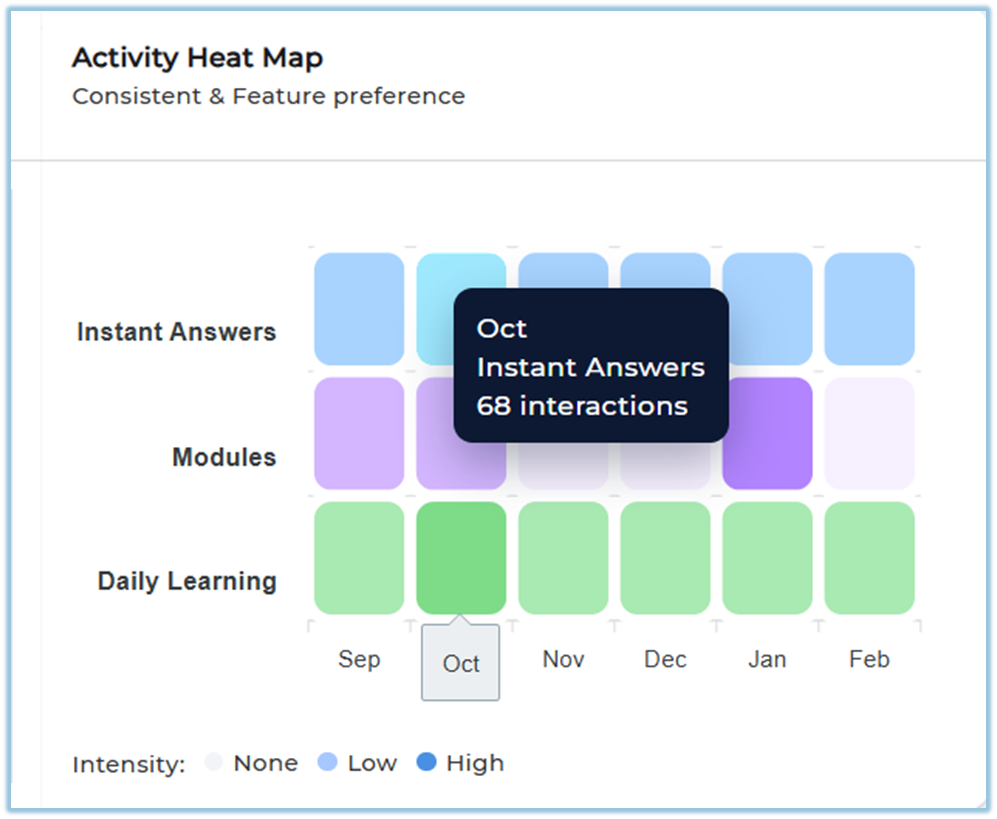
- Includes an **Activity Heat Map** that visualizes consistency and feature preference over time.
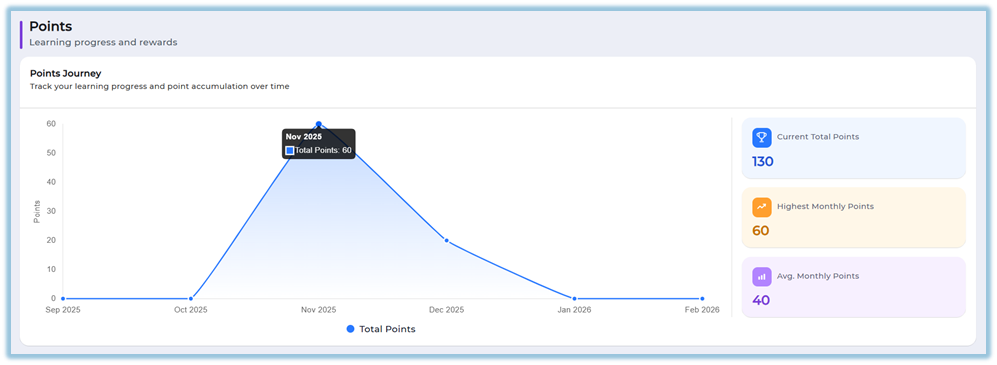
- Shows a **Points Journey** graph representing total points earned over the last six months.
- Displays current total points, highest monthly points, and average monthly points.
- Includes a **Module Completion** section showing published and completed modules using bar or line graphs.
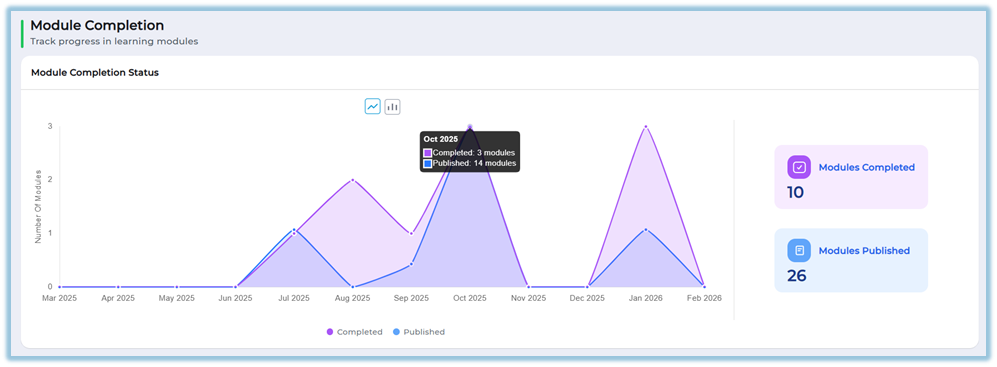
- Allows switching between completed and not completed module data.
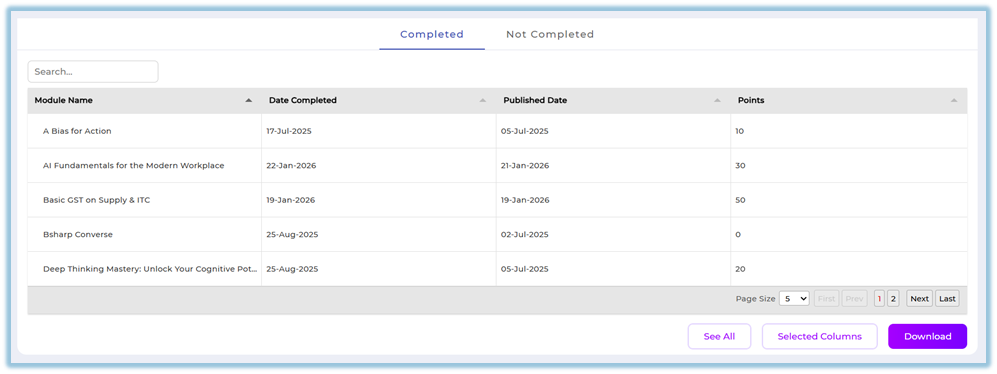
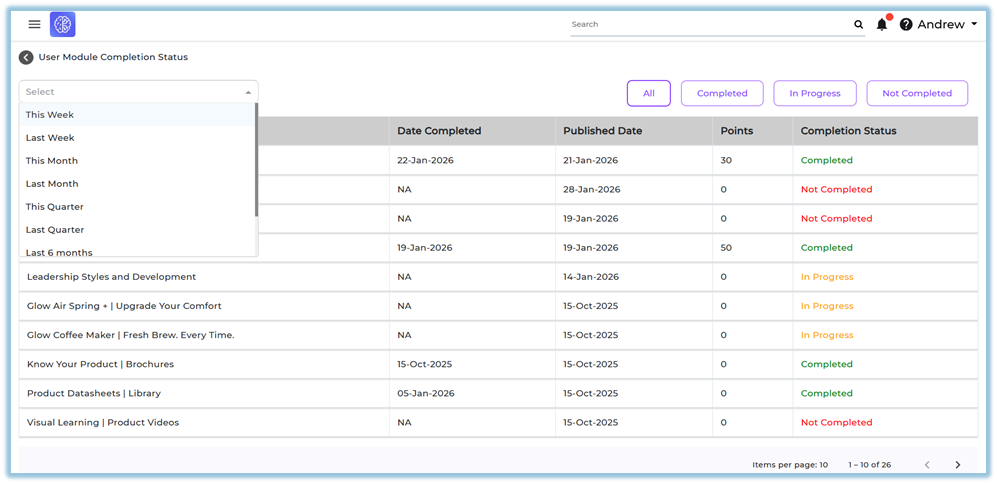
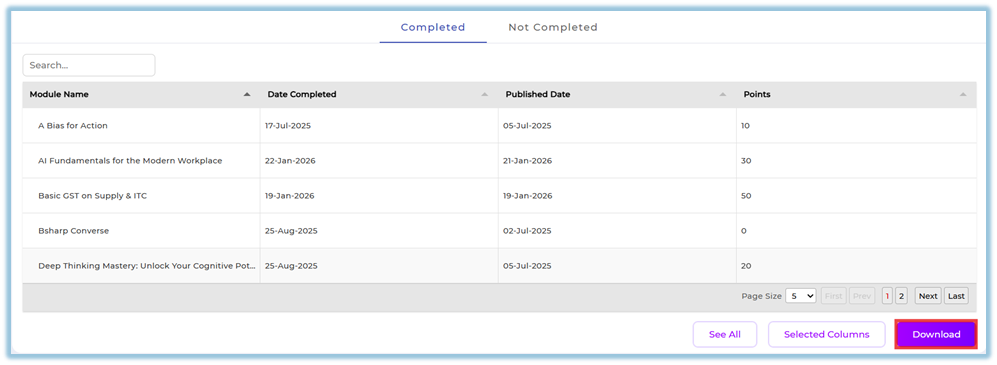
- Click **See All** to open the complete module completion list in a detailed table view.
- Provides a searchable table showing module name, completion date, published date, points, and completion status.
- Apply **date filters** to control the time range of the displayed module data.
- Use **Selected Columns** to choose which fields appear in the report.
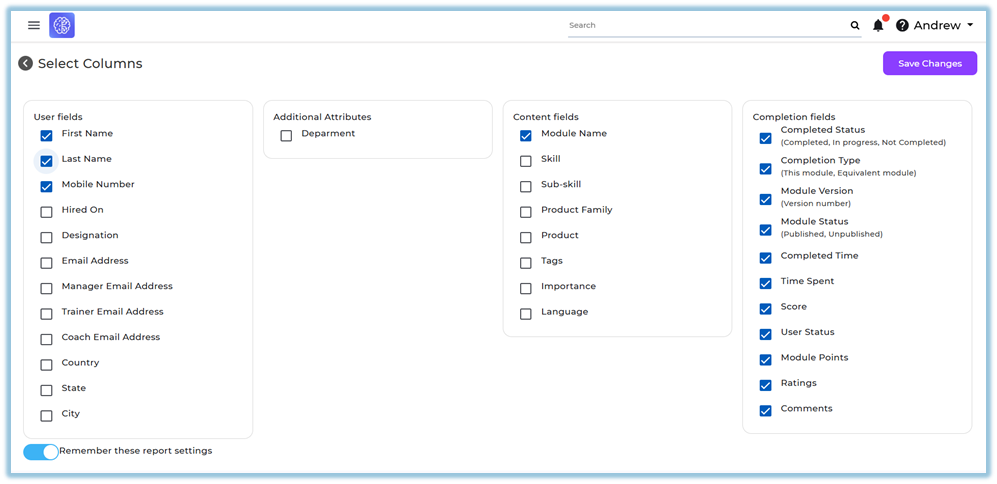
- Download the configured data for offline review or sharing.
- Includes a **Pathway Completion** section showing priority pathways and overall pathways assigned to the user.
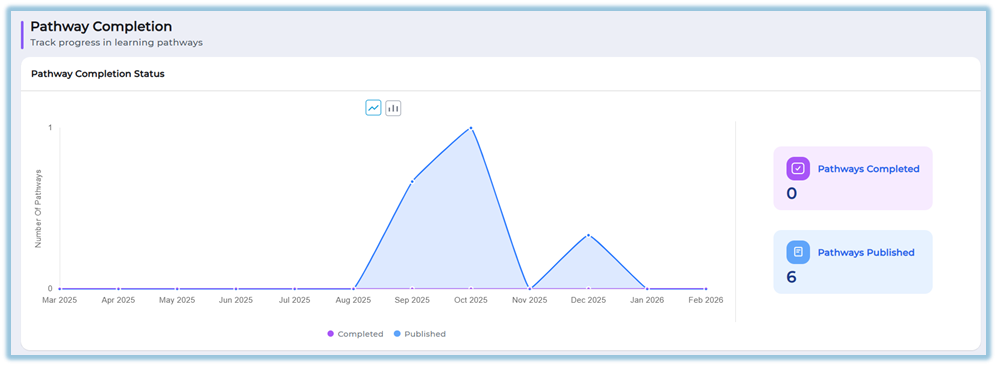
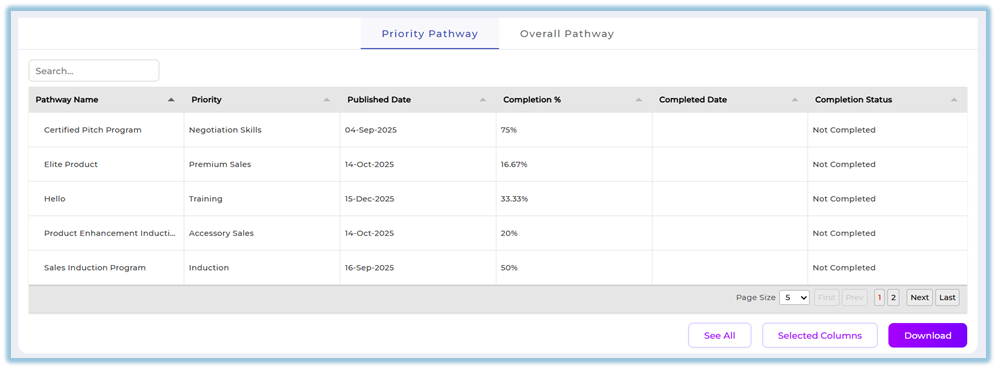
- Allows viewing, filtering, customizing columns, and downloading pathway completion data.
The report can be accessed from **Reports → User Activity Dashboard**.
[https://converse.bsharpcorp.com/celebrate/individual\_user\_reports/489](https://converse.bsharpcorp.com/celebrate/individual_user_reports/489)
### **7. Best Practices**
- Select one user at a time to ensure accurate activity tracking.
- Use graph toggle options to compare trends visually.
- Customize report columns before downloading to avoid unnecessary data.
- Apply date filters to focus on a specific time range when reviewing activity.
### **8. Related Links / FAQs**
**Who can access the User Activity Dashboard?**
Only administrators can access the User Activity Dashboard. This report is not available to team users.
### **9. Version Notes**
Last Updated: 9 Feb 2026
# Modules Completion Report Summary
### **1. Overview**
The Modules Completion Report Summary provides a consolidated view of how users are progressing across different types of modules within the platform. It helps administrators and team-level users understand overall completion trends, user participation, and average completion performance for published modules within a selected time period.
### **2. When to Use**
- When you want to review overall module completion performance across users.
- When you need a summarized view of completion percentages by module type.
- When managers, trainers, or mentors want to track completion status for their mapped users.
- When preparing completion reports for internal reviews or audits.
### **3. Concepts**
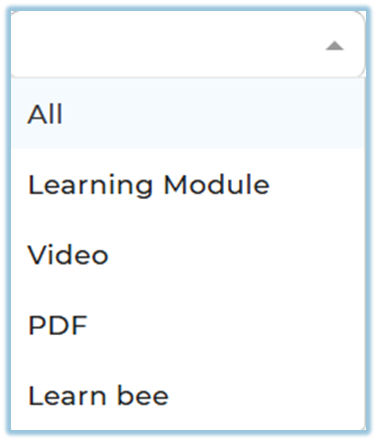
- **Module Type** – The category of learning content such as Learning Module, Video, PDF, or Learnbee.
- **Published Date Range** – The time period during which the selected modules were published.
- **Attribute Filters** – User-based filters such as designation, department, country, manager, trainer, or location.
- **Completion Distribution** – A visual breakdown of users grouped by completion percentage ranges.
- **Summary Metrics** – High-level statistics including total users, total modules, and average completion percentage.
- **User Completion Status** – User-level details showing assignment, completion count, and completion percentage.
- **Company View** – Organization-wide completion data visible to administrators.
- **Team View** – Completion data limited to users mapped to a manager, trainer, or mentor.
- **Report Download** – Exportable report data with configurable columns.
### **4. Set Up Guide**
1. Open the **Menu Bar** and click on **Reports**.
[https://converse.bsharpcorp.com/celebrate/user-report-page](https://converse.bsharpcorp.com/celebrate/user-report-page)
2. Under the **Content** section, click on **Modules Completion Report Summary**.
[https://converse.bsharpcorp.com/celebrate/user\_completion\_report](https://converse.bsharpcorp.com/celebrate/user_completion_report)
3. Select a value from **Select Module Type** (All, Learning Module, Video, PDF, Learnbee).
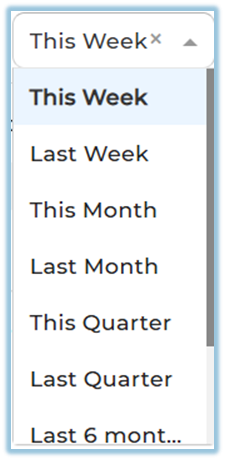
4. Choose a value from **Modules Published Date** (This Week, Last Week, This Month, Last Month, This Quarter, Last Quarter, Last 6 Months, Last 12 Months, or Custom).
5. Click **Apply** to load the report based on the selected filters.
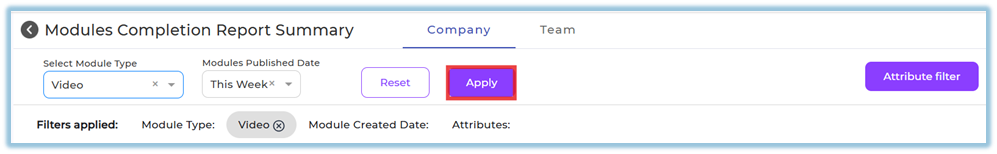
6. (Optional) Click **Attribute filter** to filter data by designation, department, country, coach email, trainer email, manager email, state, or city.
7. Select the required attribute values and click **Apply** to update the report.

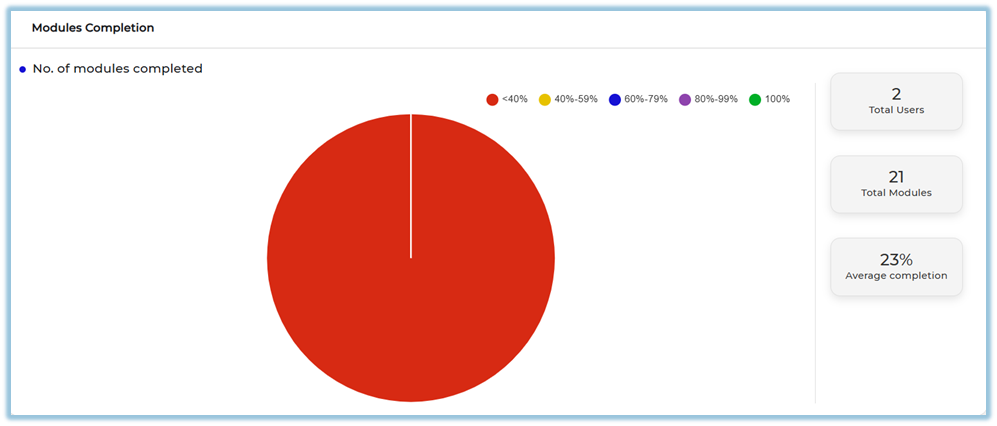
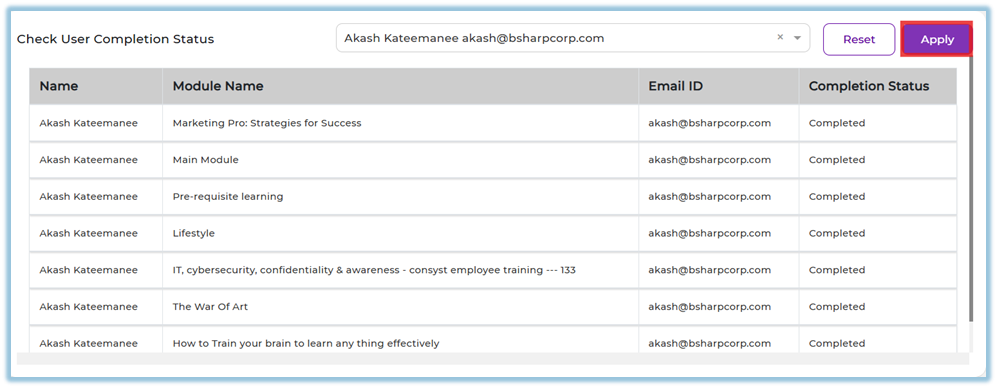
8. Scroll down to view the **Modules Completion** summary and charts.
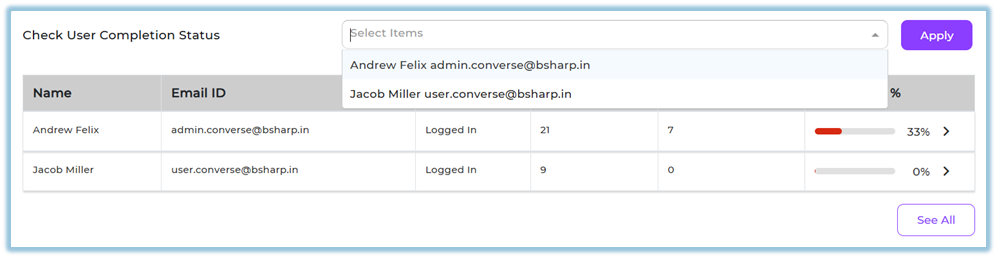
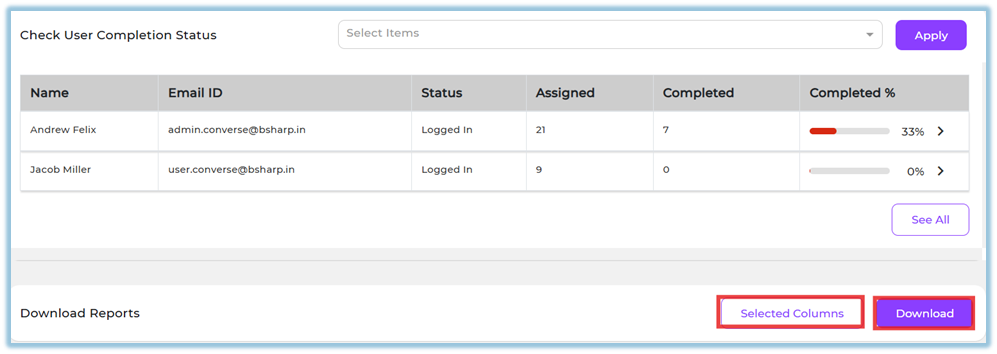
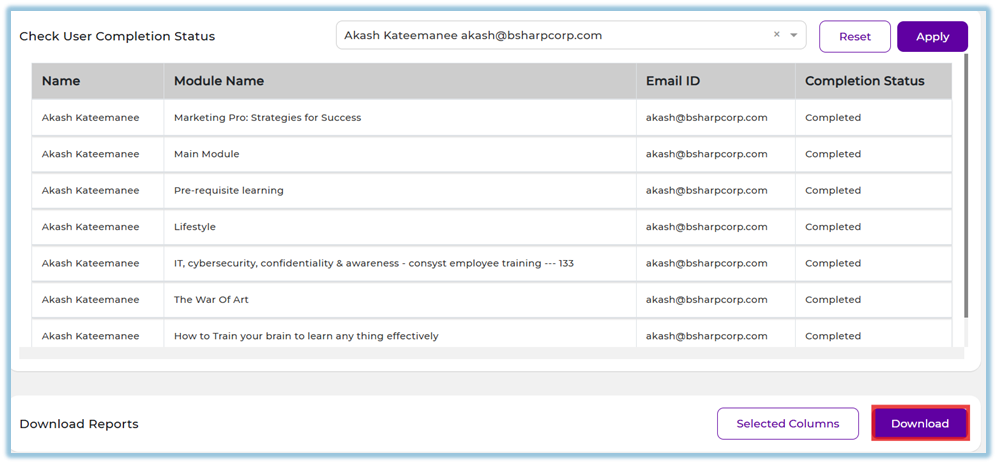
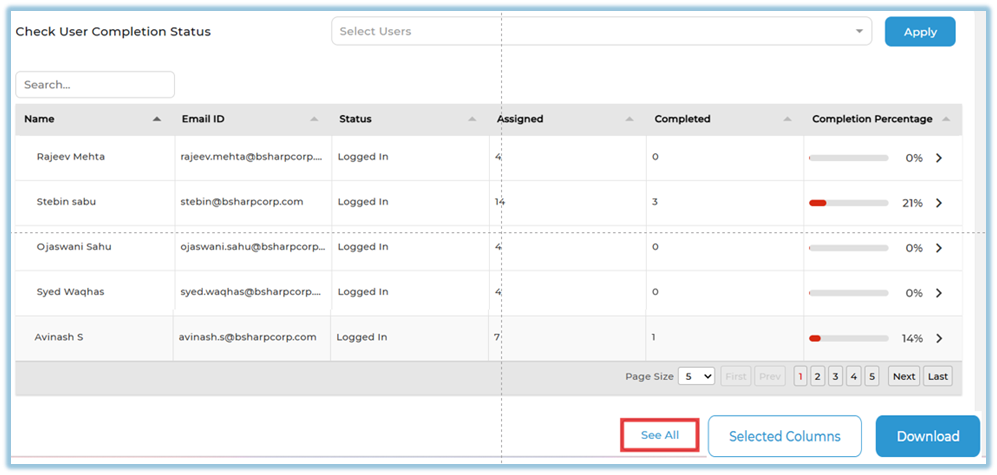
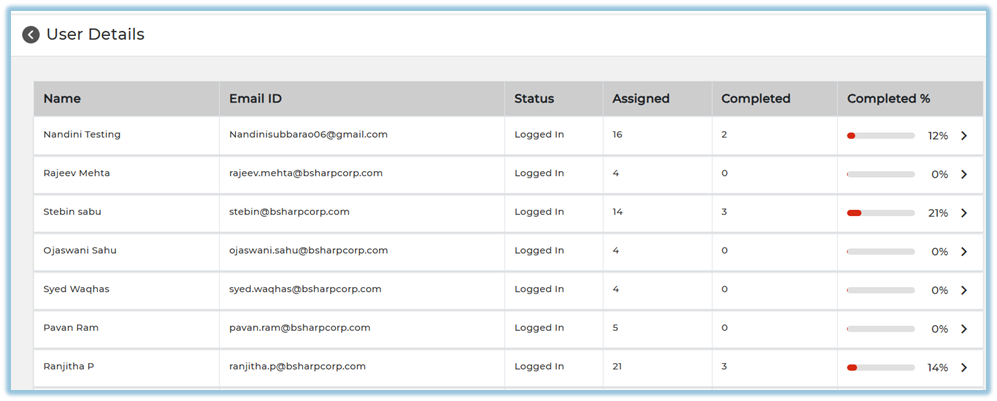
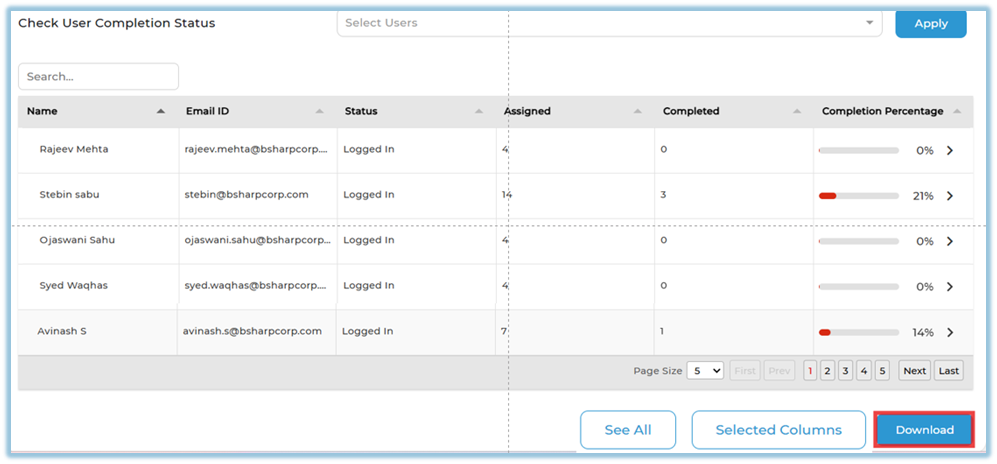
9. Use **Check User Completion Status** to view completion details for specific users.
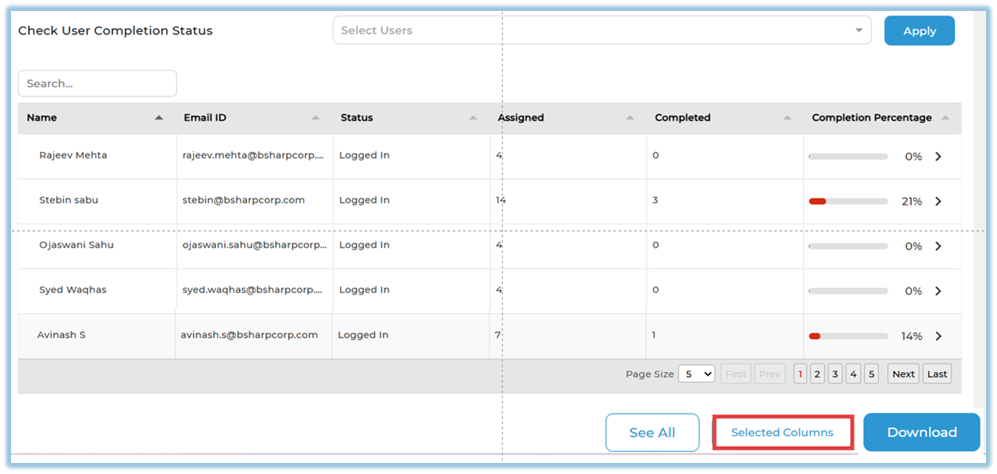
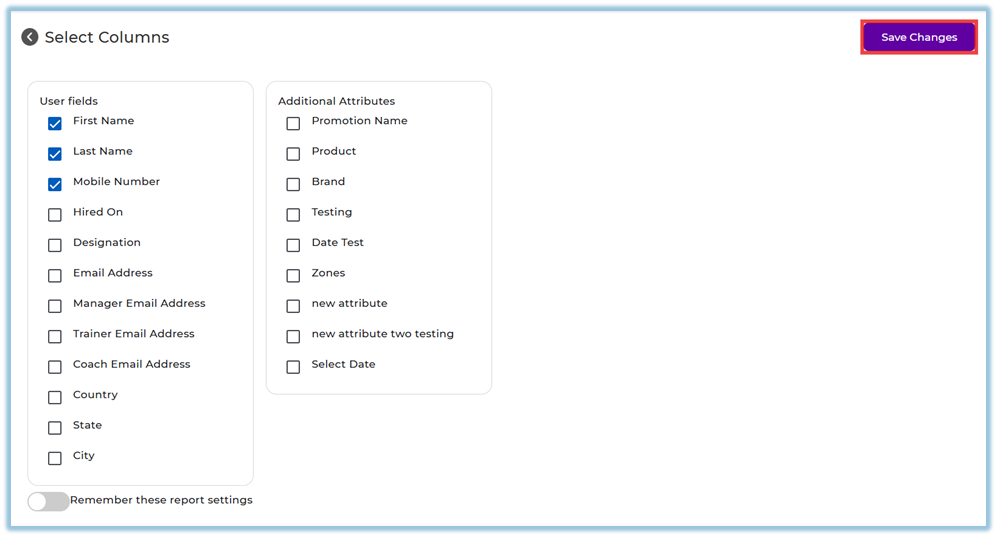
10. Click **Selected Columns** to customize the columns included in the report.
11. Click **Download** to export the report.
### **5. User View**
- Users with **admin access** can view the **Company** tab showing completion data for all users.
- Users assigned as **manager, trainer, or mentor** can view the **Team** tab showing data only for their mapped users.
- The dashboard displays completion distribution, summary metrics, and user-level completion details.
- Users can visually interpret completion status using pie charts and percentage indicators.
### **6. Reporting**
- **Modules Completion Report Summary**
- Displays total users, total modules, and average completion percentage.
- Shows completion distribution grouped by percentage ranges.
- Provides user-level completion status with assignment and completion details.
- Accessible from **Reports → Content → Modules Completion Report Summary**.
[https://converse.bsharpcorp.com/celebrate/user\_completion\_report](https://converse.bsharpcorp.com/celebrate/user_completion_report)
- Supports report export with customizable columns.
### **7. Best Practices**
- Apply date and module type filters before reviewing completion trends.
- Use attribute filters to analyze performance for specific teams or regions.
- Review user-level completion data to identify users needing follow-up.
- Customize report columns before downloading to keep reports concise.
### **8. Related Links / FAQs**
**Q: Who can access the Team tab?**
A: Only users mapped as managers, trainers, or mentors can access the Team tab.
**Q: Can I download the report for selected users only?**
A: Yes, by applying user and attribute filters before downloading.
### **9. Version Notes**
**Last Updated:** 5 Jan 2026
# Modules Completion Report Detailed
### **1. Overview**
The Modules Completion Report Detailed provides a module-level and user-level view of completion activity across selected modules, allowing admins and team-level users to analyze module delivery and completion trends over a defined time period.
### **2. When to Use**
- When you need to review detailed completion data for specific modules
- When you want to track user-level completion status for selected modules
- When managers, trainers, or mentors need visibility into their team’s module completion
- When downloading customized completion reports is required
### **3. Concepts**
- **Module selection** – Used to choose one or more modules for which completion data is displayed in the report.
- **Module created date** – Defines the time period during which the selected modules were created.
- **Module consumed date** – Defines the time period during which users consumed the selected modules.
- **Modules completion graph** – Displays module delivery and user activity trends for the selected time range.
- **User completion status** – Shows individual user-level completion details for the selected modules.
- **Report download and column customization** – Allows selecting required data fields before downloading the report.
- **Company tab and Team tab access** – Controls whether report data is shown at an organization level or limited to mapped teams.
### **4. Set Up Guide**
1. Open the **Menu bar**.
2. Click **Reports**.
[https://converse.bsharpcorp.com/celebrate/user-report-page](https://converse.bsharpcorp.com/celebrate/user-report-page)
3. Under **Content**, click **Modules Completion Report Detailed**.
[https://converse.bsharpcorp.com/celebrate/modules\_completion\_report](https://converse.bsharpcorp.com/celebrate/modules_completion_report)
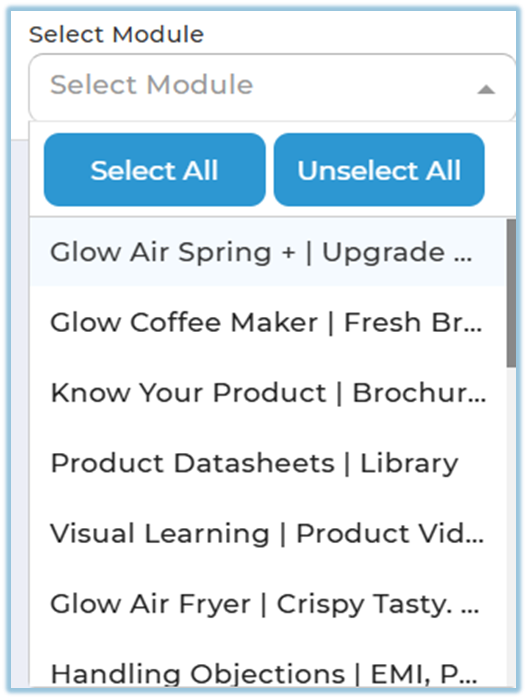
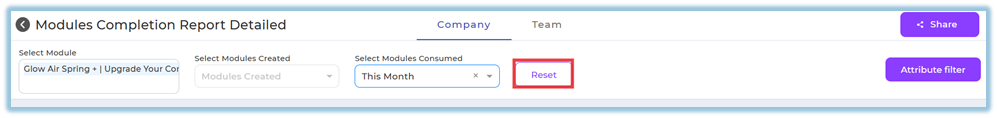
4. Select one or more modules using **Select Module**.
5. Use **Select All** or **Unselect All** if required.
6. Select a value in **Select Modules Created**.
(Shows users who completed modules that were **created within the selected date range**.)
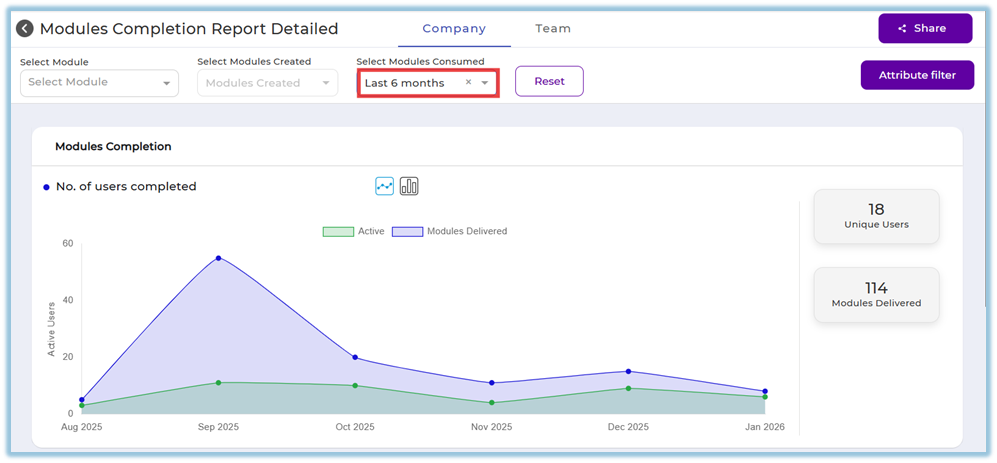
7. Select a date range in **Select Modules Consumed** (This Month, Last Month, This Quarter, Last Quarter, Last 6 months, Last 12 months, or Custom).
(Select Modules Consumed – Shows user completions based on when modules were **consumed** during the **selected period**.)
8. Click **Reset** to clear all selected filters if needed.
9. (Optional) Click **Attribute filter**, select attributes such as Designation, Department, Country, Coach Email, Trainer Email, Manager Email, State, or City, and click **Apply**.

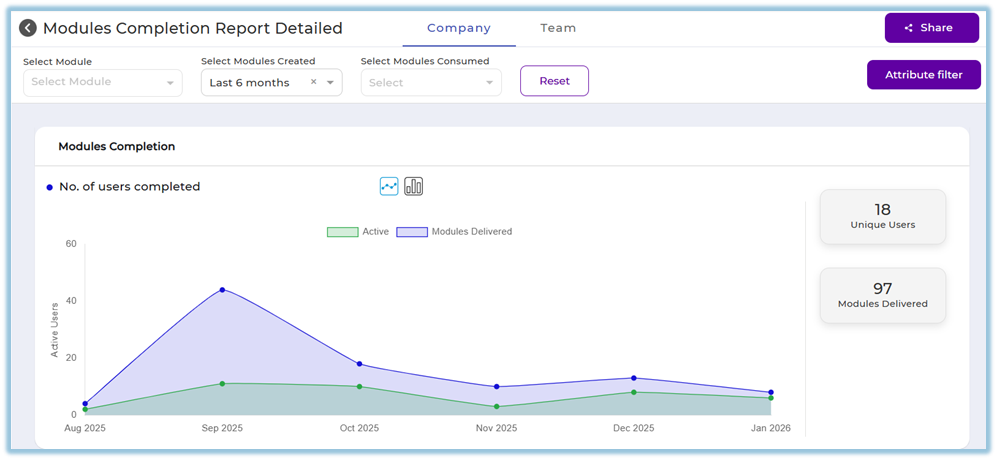
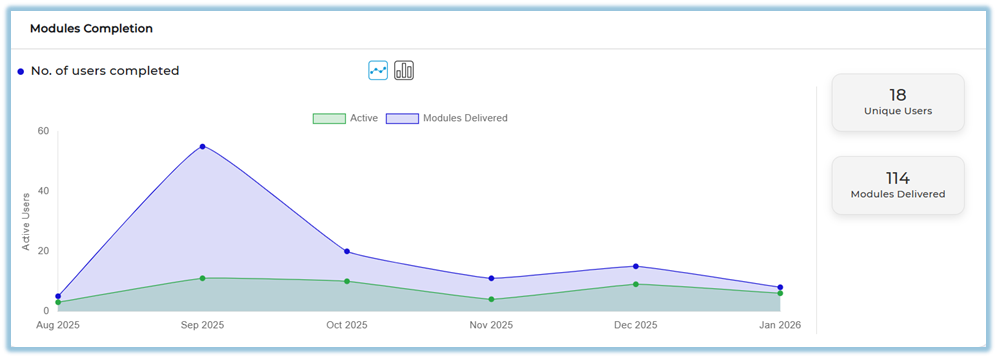
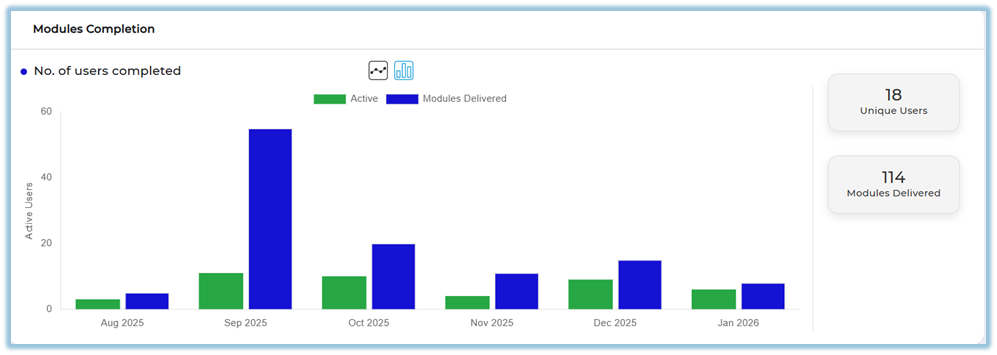
10. Scroll to view the **Modules Completion** graph showing active users and modules delivered.
11. Scroll to **Check User Completion Status** and select users using **Select Users**.
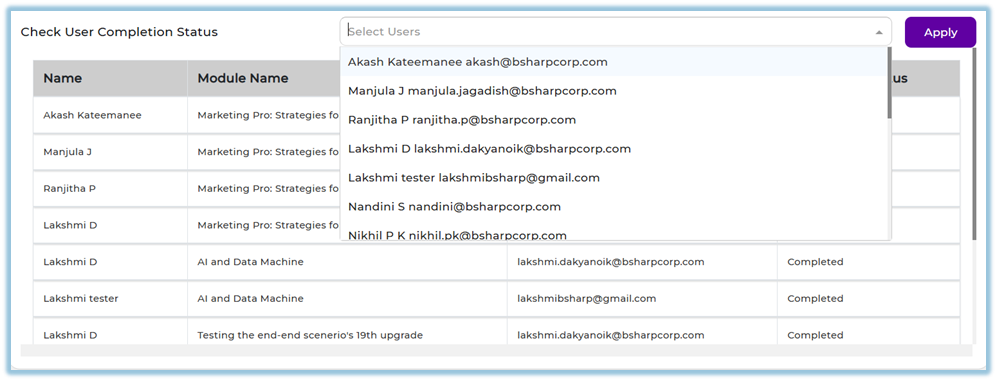
12. Click **Apply** to view completion status for selected users.
13. Scroll to **Download Reports**.
14. Click **Selected Columns** to customize report fields.
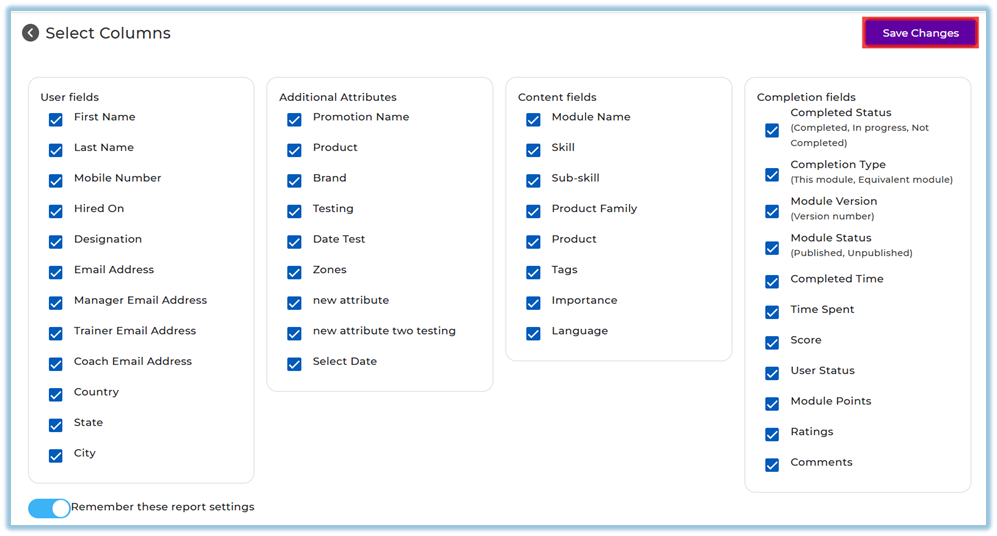
15. Click **Save changes** and then **Download** to export the report.
### **5. User View**
Users can view a graphical representation of modules delivered and user activity, followed by a table showing individual user completion status, including module name, email ID, and completion status. Download options are available at the bottom of the page.
### **6. Reporting**
- **Modules Completion Report Detailed**
- Shows module-wise and user-wise completion data
- Displays active users and modules delivered through graphs
- Provides user-level completion status in tabular format
- This report is accessed from **Reports → Content → Modules Completion Report Detailed** [https://converse.bsharpcorp.com/celebrate/modules\_completion\_report](https://converse.bsharpcorp.com/celebrate/modules_completion_report)
### **7. Best Practices**
- Apply date filters before selecting users to reduce data noise
- Use Selected Columns to download only required report fields
- Use Attribute filters for region- or role-specific analysis
- Reset filters before starting a new analysis
### **8. Related Links / FAQs**
**Q: Who can access the Team tab?**
Only users assigned as Managers, Trainers, or Mentors can access the Team tab.
**Q: Is the Team tab different from the Company tab?**
The data structure is the same, but Team tab shows only users mapped to the logged-in user.
### **9. Version Notes**
Last Updated: 5 Jan 2026
# Single Pathway Completion Report
### **1. Overview**
The Single Pathway Completion Report provides completion details for one selected learning pathway, showing user-wise progress and completion status for each card within the pathway.
### **2. When to Use**
- When you need to review completion status for a specific learning pathway.
- When tracking how users are progressing across cards within a single pathway.
- When managers, trainers, or coaches need visibility into pathway completion for their mapped users.
- When validating overall completion percentages for a single pathway.
### **3. Concepts**
- **Single Pathway** – One learning pathway selected at a time.
- **Company Tab** – Shows data for all users (Admin only).
- **Team Tab** – Shows data for mapped users (Manager/Trainer/Coach).
- **Attribute Filter** – Filters users by attributes.
- **Completion Chart** – Shows completed vs not completed users.
- **Completion Summary** – Displays total users and completion percentage.
- **User Completion Table** – Shows user-level completion details.
- **User Drill-down** – Opens individual user journey details.
- **Selected Columns** – Controls fields in the downloaded report.
- **Download Report** – Exports pathway completion data.
### **4. Set Up Guide**
1. Open the **menu bar** and navigate to **Reports**.
[https://converse.bsharpcorp.com/celebrate/user-report-page](https://converse.bsharpcorp.com/celebrate/user-report-page)
2. Go to the **Learning Pathway** section under Reports.
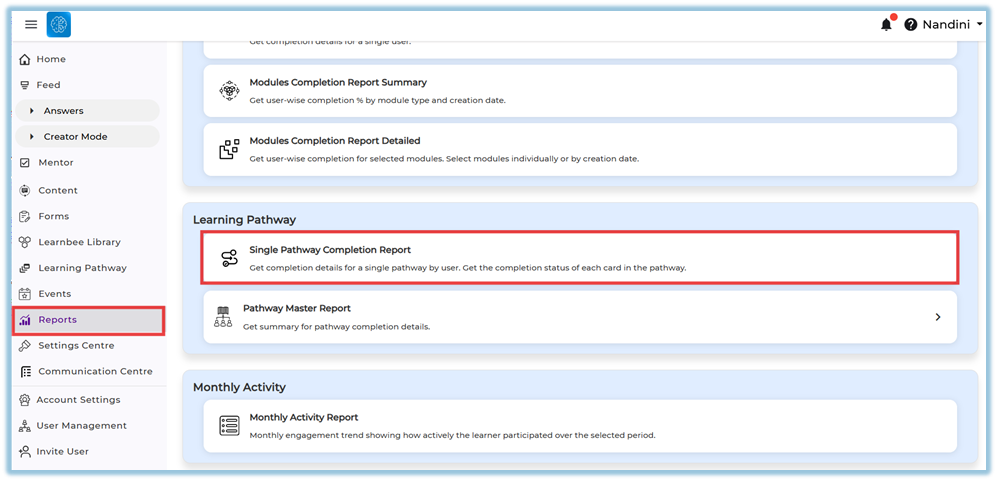
3. Select **Single Pathway Completion Report**.
[https://converse.bsharpcorp.com/celebrate/pathway\_individual\_report/0](https://converse.bsharpcorp.com/celebrate/pathway_individual_report/0)
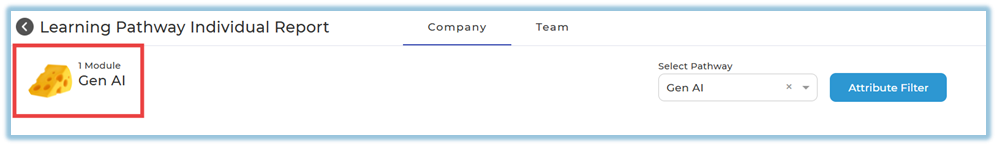
4. Choose **one pathway** from the pathway selection dropdown.
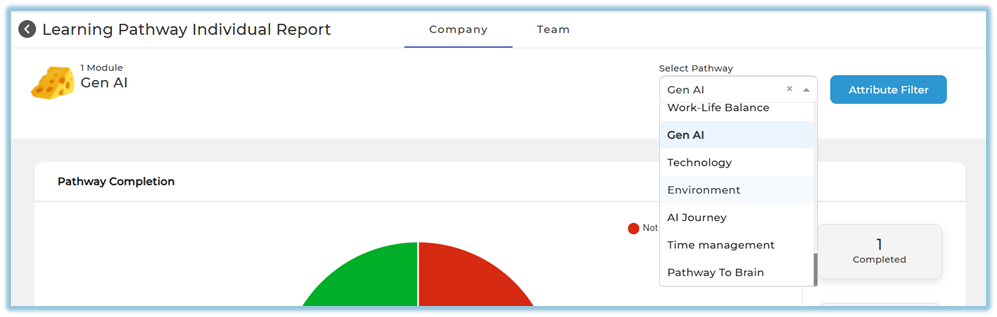
5. Review the pathway details shown on the left side, including the pathway name and number of cards.
6. Click **Attribute filter** to apply attribute-based filtering if required.
7. Select an attribute and value, then click **Apply**.

8. Review the updated completion data and charts based on the applied filters.
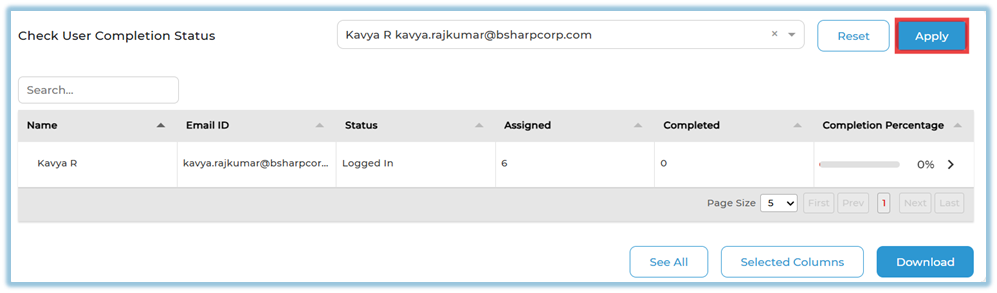
9. Use **Check User Completion Status** to select users by name or search.
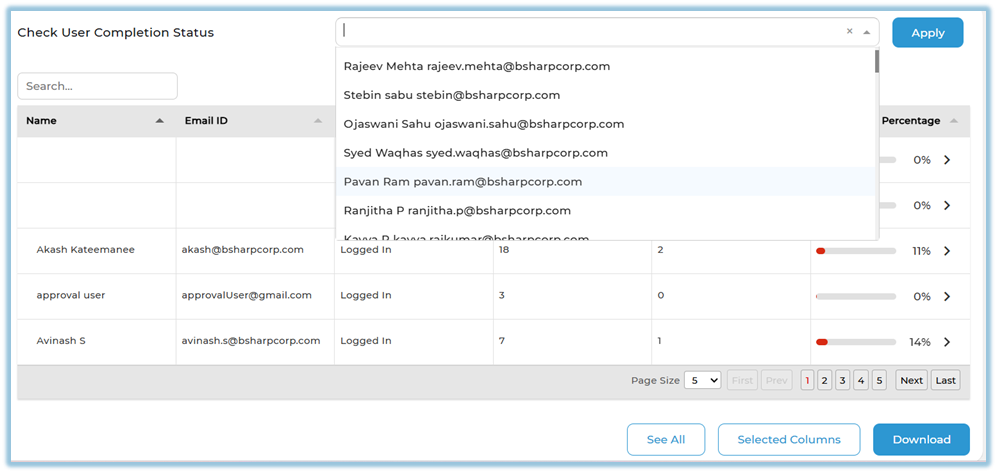
10. Click **Apply** to view user-level completion details.
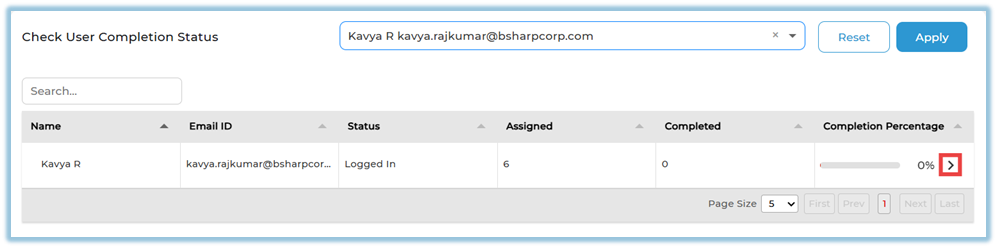
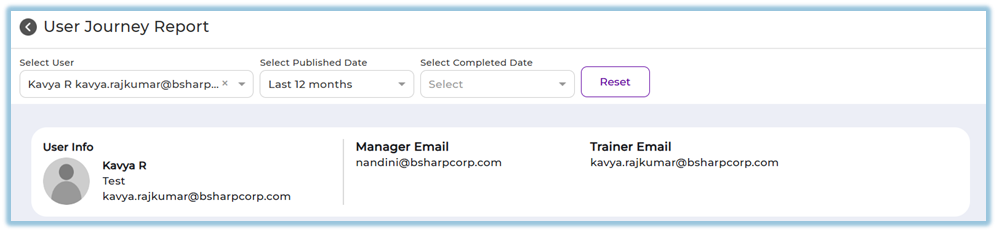
11. Click the arrow icon against a user to navigate to the **User Journey Report**.
12. Click **See All** to view completion details for all users.
13. Click **Selected Columns** to customize report columns.
14. Click **Save changes** and then **Download** to export the report.
### **5. User View**
- Admins see the **Company** tab.
- Managers, Trainers, and Coaches see the **Team** tab.
- Completion charts and user tables are visible based on access.
### **6. Reporting**
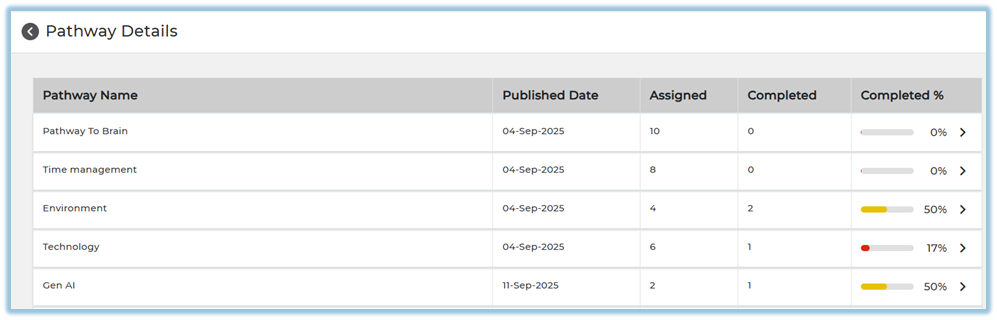
- **Single Pathway Completion Report**
- Shows completion status for a selected pathway at user level.
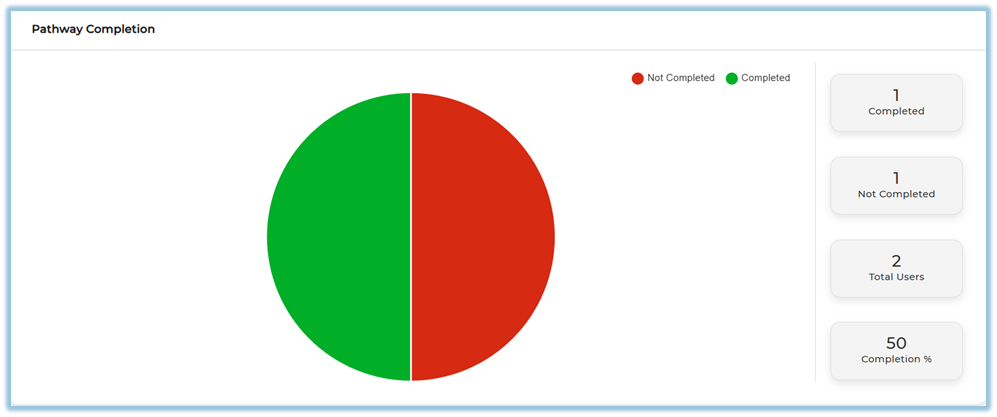
- Displays completed and not completed users using a pie chart.
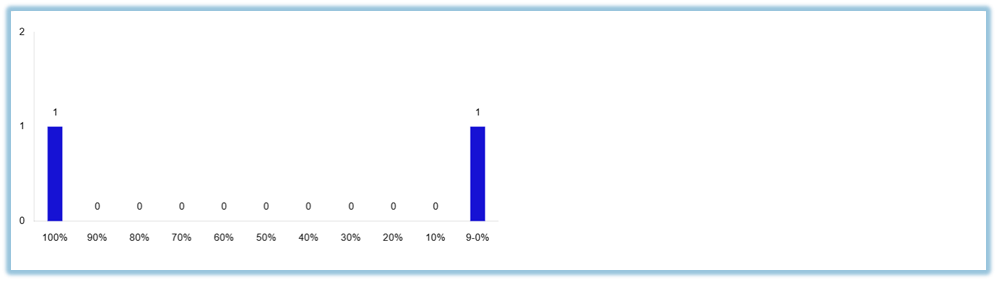
- Provides total users, completed users, not completed users, and overall completion percentage.
- Allows redirection to **User Journey Report** for detailed user activity.
- Accessible from **Reports → Learning Pathway → Single Pathway Completion Report**.
### **7. Best Practices**
- Select only one pathway, as this report supports single-pathway analysis.
- Apply attribute filters to narrow results to relevant user groups.
- Use user-level completion view for follow-ups and coaching.
- Customize columns before downloading to avoid unnecessary data.
### **8. Related Links / FAQs**
- **What happens when I click the arrow icon next to a user?**
It redirects to the User Journey Report for that user.
- **Why can I select only one pathway?**
This report is designed for individual pathway analysis.
### **9. Version Notes**
Last Updated: 6 Jan 2026
# Learning Pathway Master Report
### **1. Overview**
The Learning Pathway Master Report provides a consolidated view of pathway performance across the organization. It helps track completion status, compare pathway types (Normal and Mandatory), and analyze learning progress using filters and summary insights.
### **2. When to Use**
- When tracking completion status of all learning pathways
- When monitoring Mandatory vs Normal pathway performance
- When reviewing recent pathway trends based on time period
- When analyzing completion across teams or attributes
### **3. Concepts**
- **Pathway Created Date** – Filters pathways based on when they were created in the system.
- **Custom Date Range** – Allows selecting a specific start and end date for analysis.
- **Pathway Type (Normal / Mandatory)** – Defines whether the pathway is a regular learning pathway or a mandatory one that must be completed within a set timeline.
- **Attribute Filter** – Narrows report data using user attributes like department or location.
- **Company Tab** – Displays pathway completion data for all users in the organization.
- **Team Tab** – Displays pathway completion data only for users mapped to the manager, trainer, or mentor.
- **Last 10 Pathways** – Shows completion status of the most recently published pathways.
- **Average Completion %** – Indicates the overall average completion percentage across pathways.
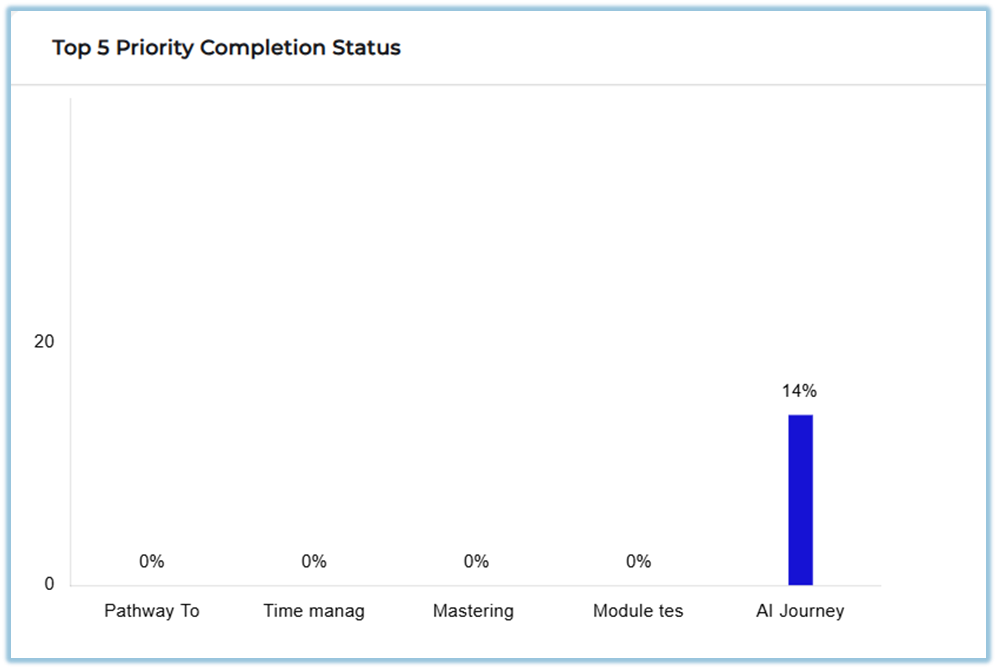
- **Top 5 Priority Pathways** – Highlights completion status of pathways marked as top priorities.
- **Pathway Completion Status** – Shows completion percentage for each pathway.
- **Pathway Drill-down** – Allows navigation to the individual pathway completion report.
- **See All** – Opens a detailed view of all pathway records.
- **Download Report** – Exports pathway completion data for offline review.
### **4. Set Up Guide**
1. **Open Menu** and navigate to **Reports**.
[https://converse.bsharpcorp.com/celebrate/user-report-page](https://converse.bsharpcorp.com/celebrate/user-report-page)
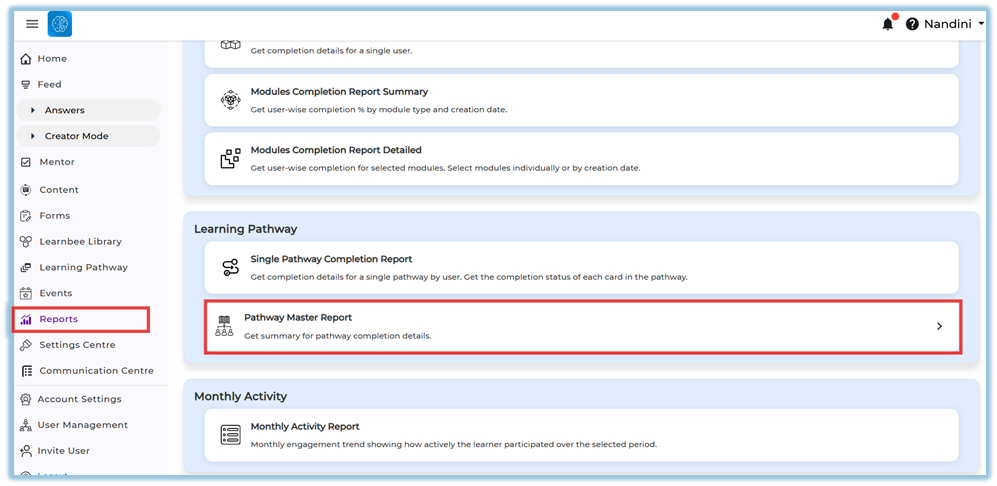
2. Under **Learning Pathway**, select **Learning Pathway Master Report**.
[https://converse.bsharpcorp.com/celebrate/pathway\_master\_report](https://converse.bsharpcorp.com/celebrate/pathway_master_report)
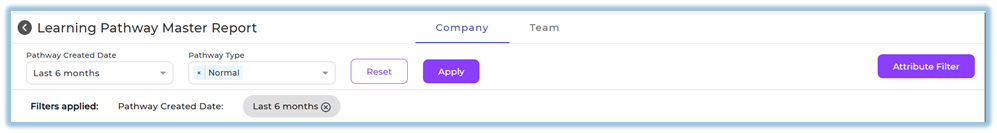
3. Select **Pathway Created Date**
Choose predefined range OR custom date
4. Select **Pathway Type**
- Normal
- Mandatory
5. Click **Attribute Filter** (optional)
- Select attribute (Department, Role, etc.)
- Select values
- Click Apply

6. Click **Apply** to load the filtered report data.
7. Review the **dashboard summary**, including average completion percentage and recent pathway completion trends.
8. View the **last 10 published pathways** and their completion percentages displayed on the dashboard.
9. Review **priority pathway completion status** shown for the top priority pathways.
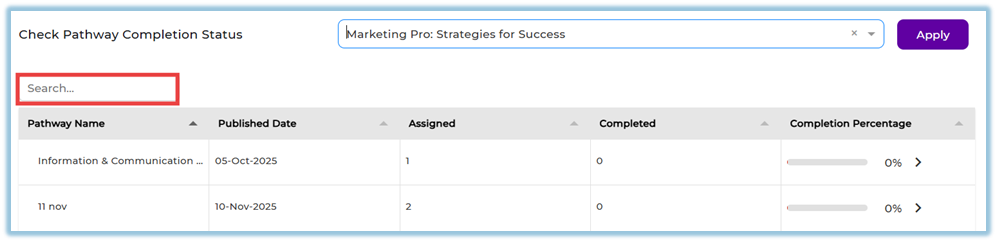
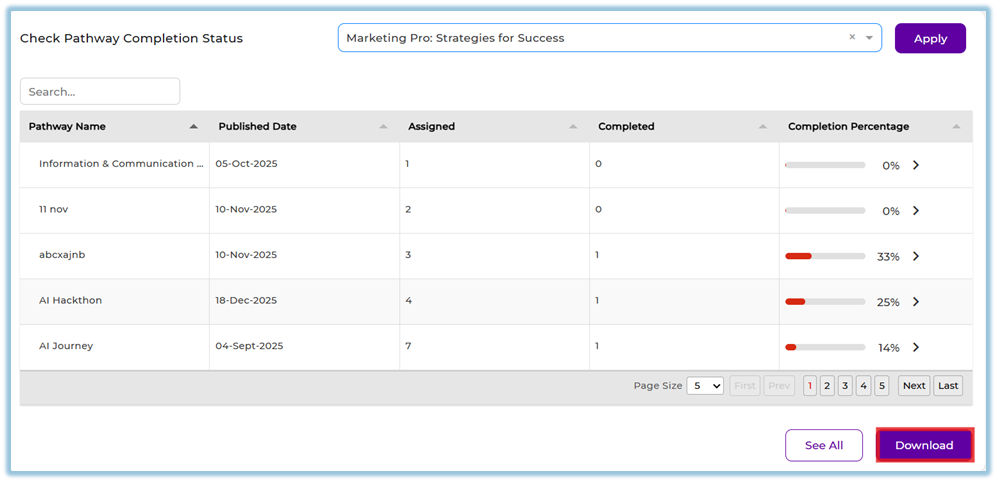
10. In **Check Pathway Completion Status**, select a **Pathway** to view its completion details.
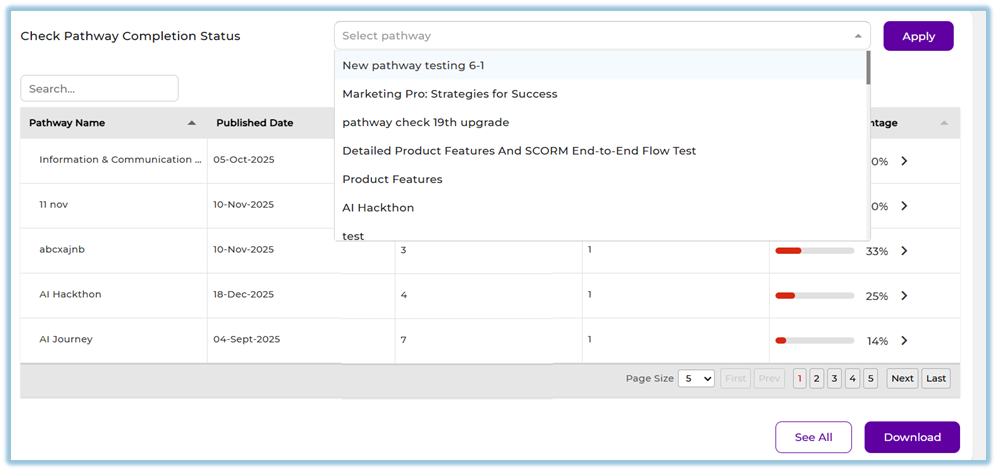
11. Use the **Search** option to find a specific pathway (reset filters before searching if required).
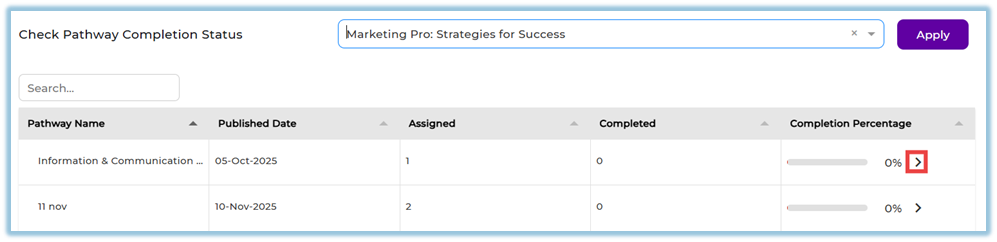
12. Click the **arrow icon** next to a pathway to open the **Single Pathway Completion Report**.
13. Use **See All** to view all pathway details.
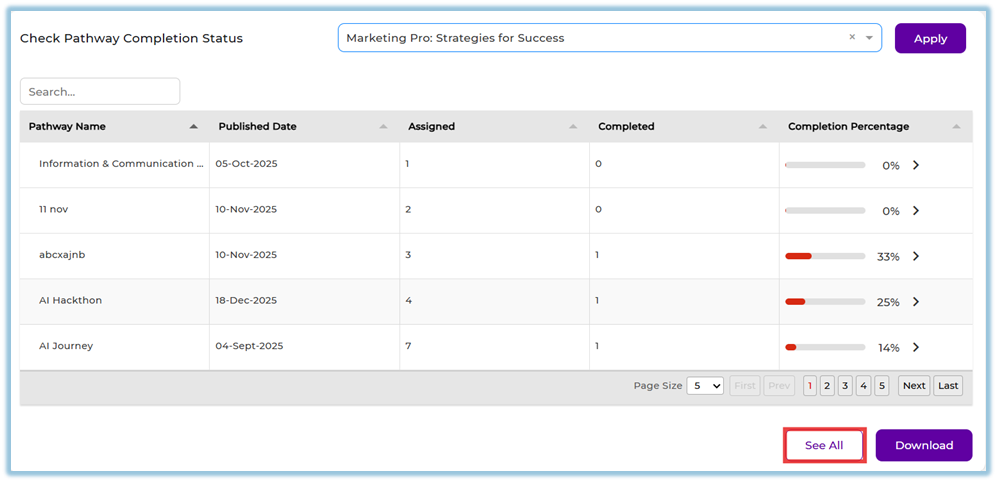
14. Click **Download** to export the report.
### **5. User View**
Admins can view all pathways and completion data in the **Company** tab.
Managers, Trainers, and Mentors can view only their mapped users’ pathway data in the **Team** tab.
Completion charts, percentages, and summaries are visible based on access level.
### **6. Reporting**
- Tracks pathway performance using **Pathway Master Report**
- Supports **Normal & Mandatory Pathway filtering**
- Displays pathway-wise completion percentages
- Shows average completion across all pathways
- Highlights priority pathway performance
- Supports drill-down to individual pathway reports
### **7. Best Practices**
- Use date filters to analyze relevant time periods
- Apply attributes to focus on specific user groups
- Regularly monitor priority pathway completion
- Use drill-down reports for deeper analysis
### **8. Related Links / FAQs**
**Can I see user-level completion here?**
No, this report shows pathway-level summary data.
**Why is some data not visible to me?**
Visibility depends on Company or Team tab access.
### **9. Version Notes**
**Last Updated:** 25 Mar 2026
# Monthly Activity Report
### **1. Overview**
The Monthly Activity Report provides a consolidated view of user engagement across the platform. It displays activity trends, feature usage, completion metrics, inactive users, publishing trends, and leaderboards using visual dashboards and summary cards.
### **2. When to Use**
- When you want to review overall engagement across the organization.
- When analyzing feature usage trends such as Instant Answers, Daily Learning, and Content.
- When tracking module and pathway completion trends.
- When identifying inactive users or reviewing monthly leaderboard performance.
### **3. Concepts**
- **Company Tab** – Displays activity data for the entire organization.
- **Team Tab** – Displays activity data limited to users mapped to the viewer.
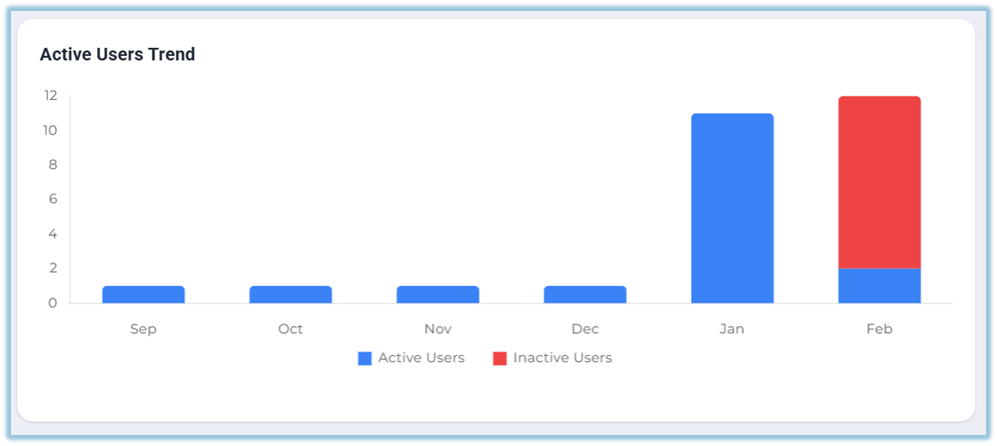
- **Active Users Trend** – Shows monthly active and inactive user comparison.
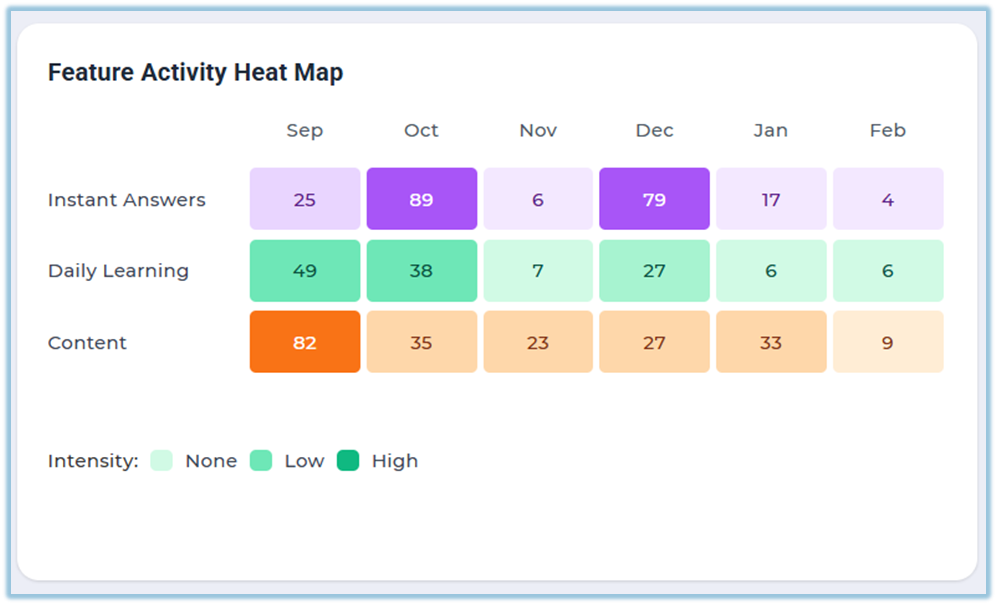
- **Feature Activity Heat Map** – Displays usage intensity across features.
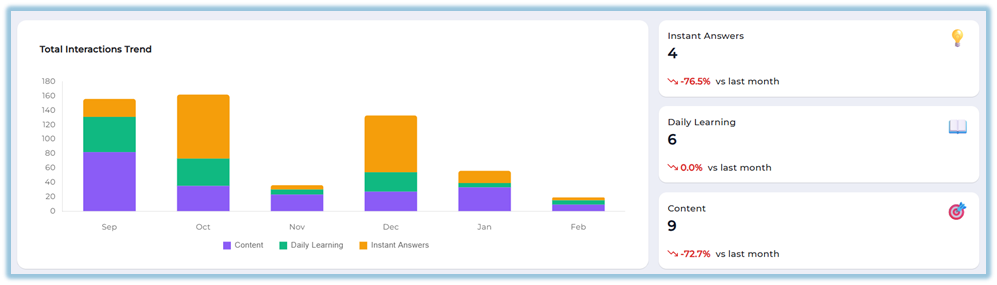
- **Total Interactions Trend** – Shows total completed interactions across features.
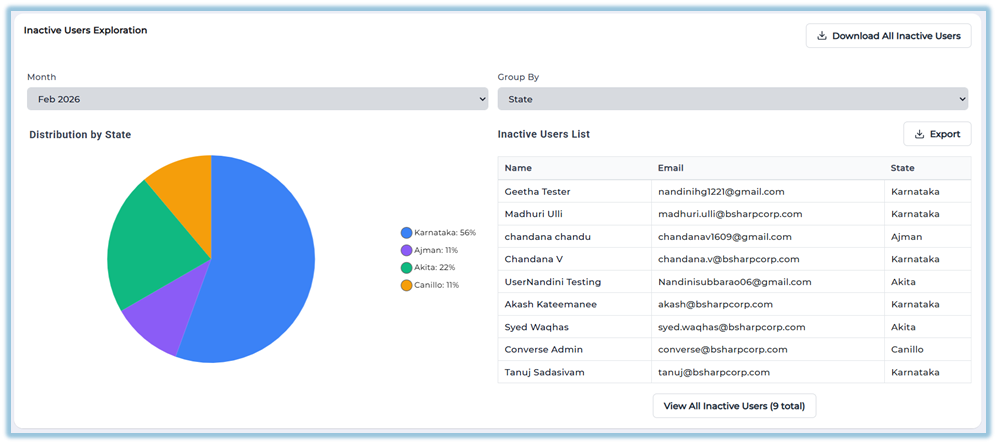
- **Inactive Users Exploration** – Displays inactive user distribution and detailed list.
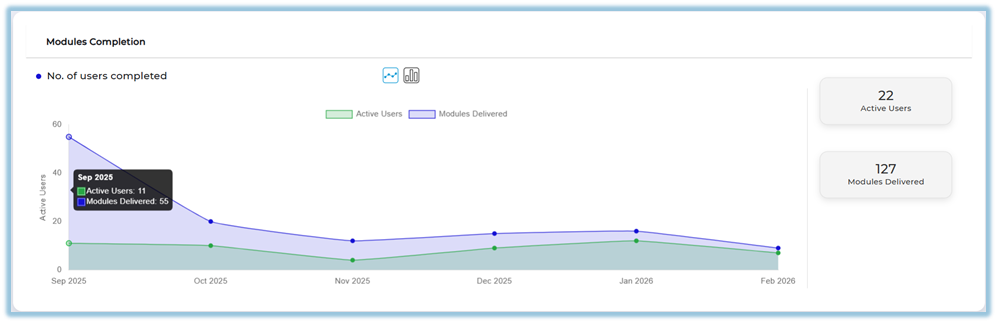
- **Modules Completion** – Shows number of users completed and modules delivered.
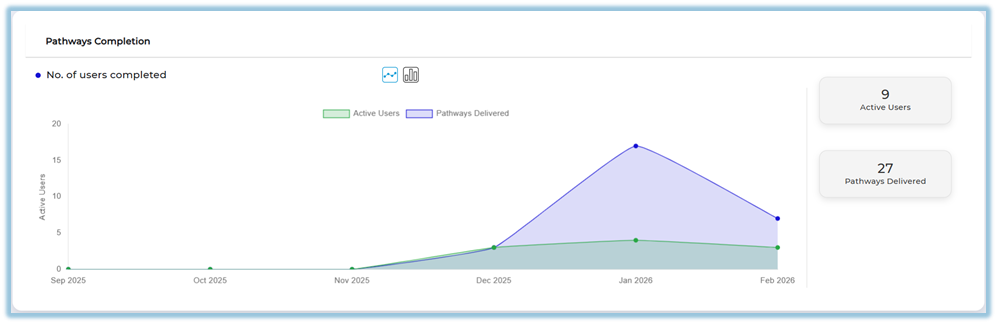
- **Pathways Completion** – Displays pathway delivery and completion trends.
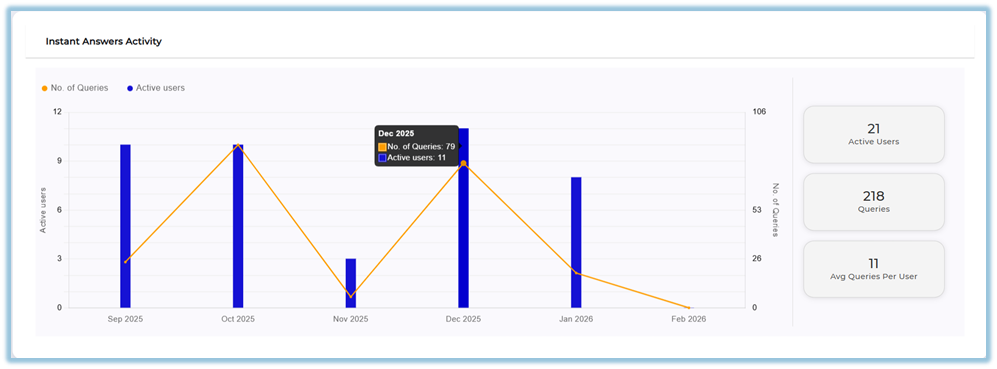
- **Instant Answers Activity** – Shows query count and active users.
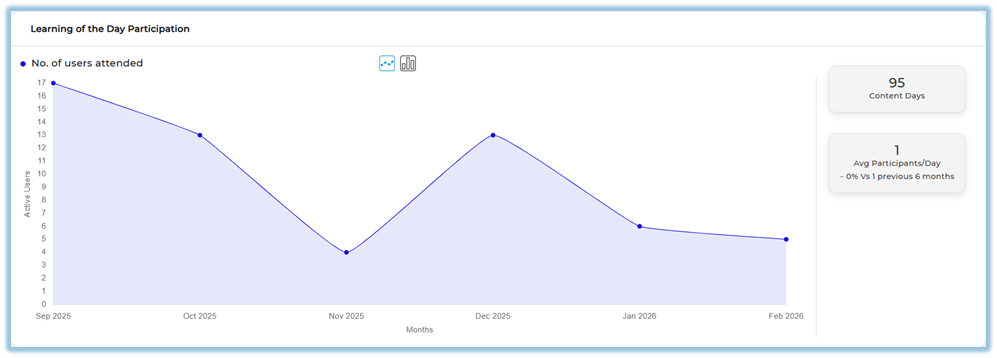
- **Learning of the Day Participation** – Displays participation trends.
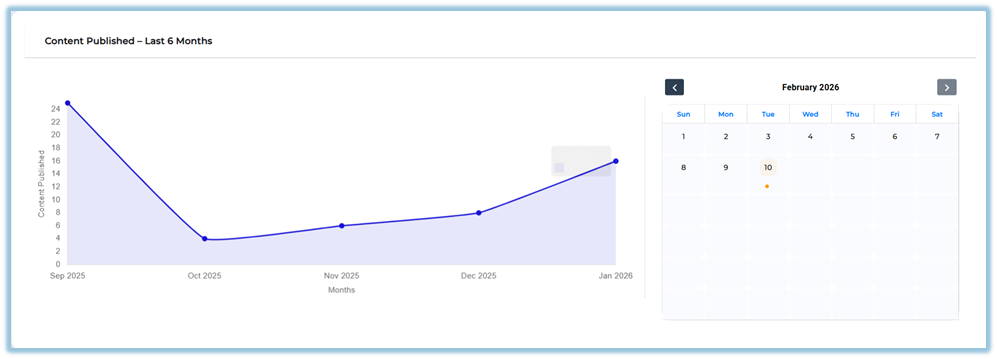
- **Content Published – Last 6 Months** – Shows content publishing trends and calendar view.
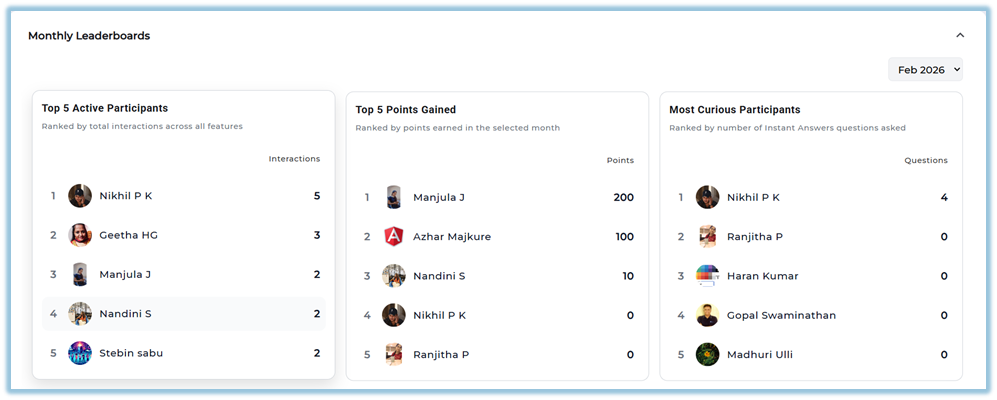
- **Monthly Leaderboards** – Displays top participants based on different metrics.
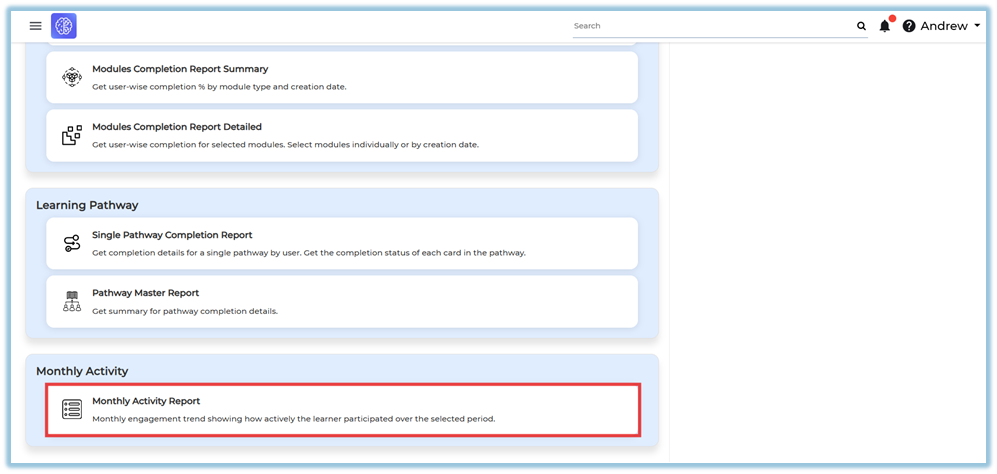
### **4. Set Up Guide**
1. Click the three-line **Menu** from the homepage.
2. Click **Reports**.
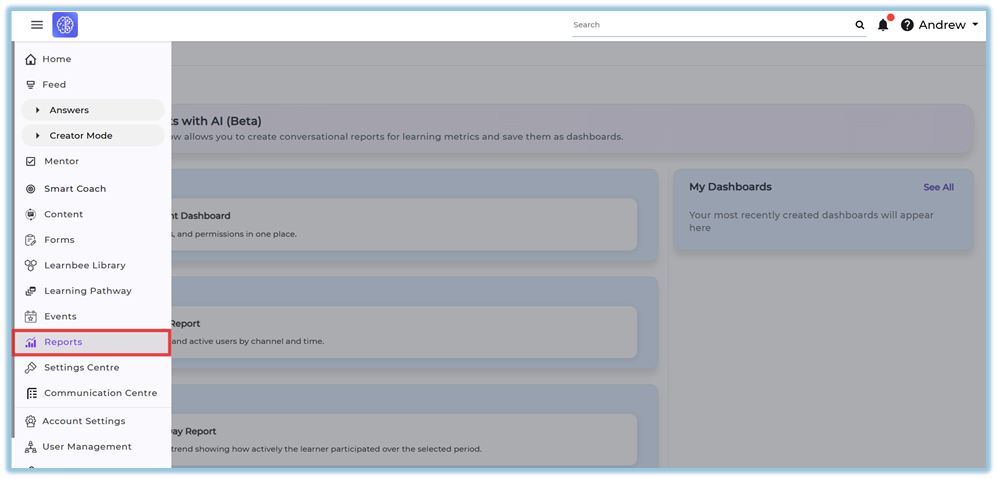
3. Select **Monthly Activity Report**.
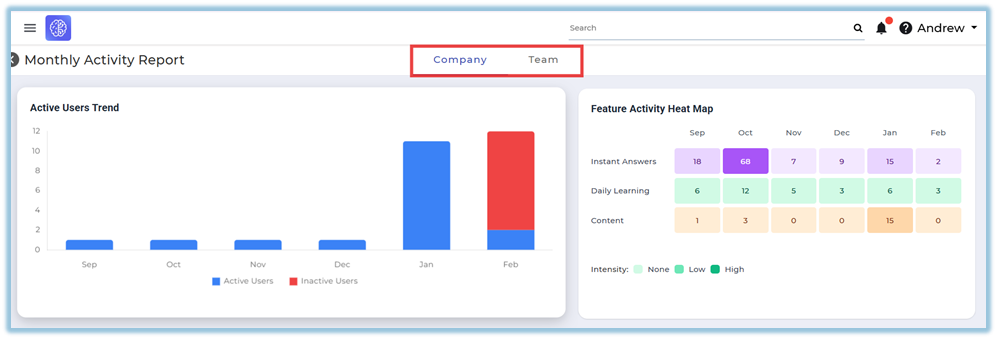
4. The report opens with two tabs: **Company** and **Team**.
5. Select the appropriate tab based on your access level.
6. Review the **Active Users Trend** section to see monthly active and inactive users.
7. Review the **Feature Activity Heat Map** to analyze usage intensity for:
- Instant Answers
- Daily Learning
- Content
8. Scroll to **Total Interactions Trend** to view interaction breakdown across features.
9. Review the summary cards for:
- Instant Answers
- Daily Learning
- Content
10. Scroll to **Inactive Users Exploration** to:
- Select the month
- Choose grouping criteria (e.g., State)
- View distribution chart
- View inactive users list
- Use **Download All Inactive Users** if required.
11. Review **Modules Completion** to compare Active Users and Modules Delivered.
12. Review **Pathways Completion** to track pathway activity trends.
13. Review **Instant Answers Activity** to analyze queries and active users.
14. Review **Learning of the Day Participation** for participation trends.
15. Review **Content Published – Last 6 Months** and use the calendar view to identify publishing dates.
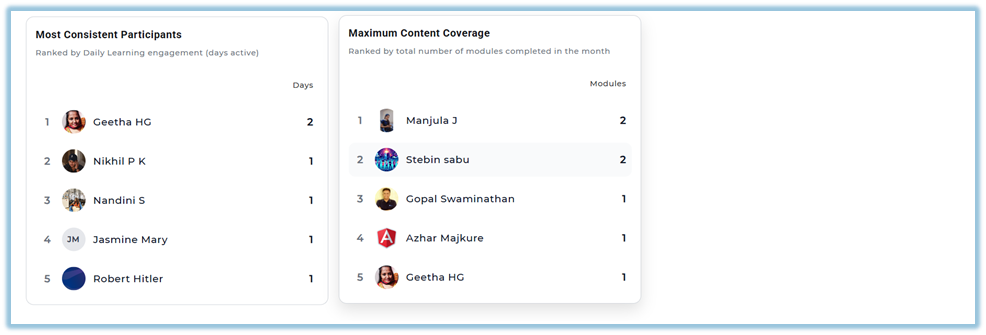
16. Scroll to **Monthly Leaderboards** to view:
- Top 5 Active Participants
- Top 5 Points Gained
- Most Curious Participants
- Most Consistent Participants
- Maximum Content Coverage
### **5. User View**
- **Admins** can access the report under the **Company tab**, showing complete organizational data.
- **Managers, Trainers, and Coaches** can access the report under the **Team tab**, showing only users mapped to them.
- The report is presented entirely through visual dashboards including:
- Bar charts
- Line graphs
- Heat maps
- Summary metric cards
- Pie charts
- Calendar indicators
- Leaderboard tables
### **6. Reporting**
The Monthly Activity Report provides visual dashboards summarizing engagement trends.
- **Active Users Trend** – Displays monthly comparison of active and inactive users.
- **Feature Activity Heat Map** – Shows feature usage intensity across Instant Answers, Daily Learning, and Content.
- **Total Interactions Trend** – Displays total completed interactions across features by month.
- **Inactive Users Exploration** – Shows inactive user distribution and a detailed inactive users list.
- **Modules Completion** – Displays active users and modules delivered over time.
- **Pathways Completion** – Shows active users and pathways delivered trends.
- **Instant Answers Activity** – Displays number of queries and active users.
- **Learning of the Day Participation** – Shows user participation trends over time.
- **Content Published – Last 6 Months** – Displays publishing trends with a calendar view.
- **Monthly Leaderboards** – Displays top participants based on interactions, points, curiosity, consistency, and content coverage.
The report can be accessed from:
**Menu → Reports → Monthly Activity Report** [https://converse.bsharpcorp.com/celebrate/monthly\_activity\_report](https://converse.bsharpcorp.com/celebrate/monthly_activity_report)
Full report download is not available. Export options may be available within specific sections.
### **7. Best Practices**
- Review multiple sections together for better insight correlation.
- Monitor inactive users regularly for follow-up actions.
- Use leaderboard data for performance recognition.
- Validate content publishing using the calendar indicators.
- Compare feature usage patterns across months.
### **8. Related Links / FAQs**
**Q: What does the orange dot in the calendar indicate?**
A: The orange dot indicates that content was created on that specific date.
**Q: What is the difference between Company and Team tabs?**
A: The Company tab shows organization-wide data. The Team tab shows data limited to users mapped to the viewer.
### **9. Version Notes**
Last Updated: 11 Feb 2026
# Reports Central – Overview & Navigation
### **1. Overview**
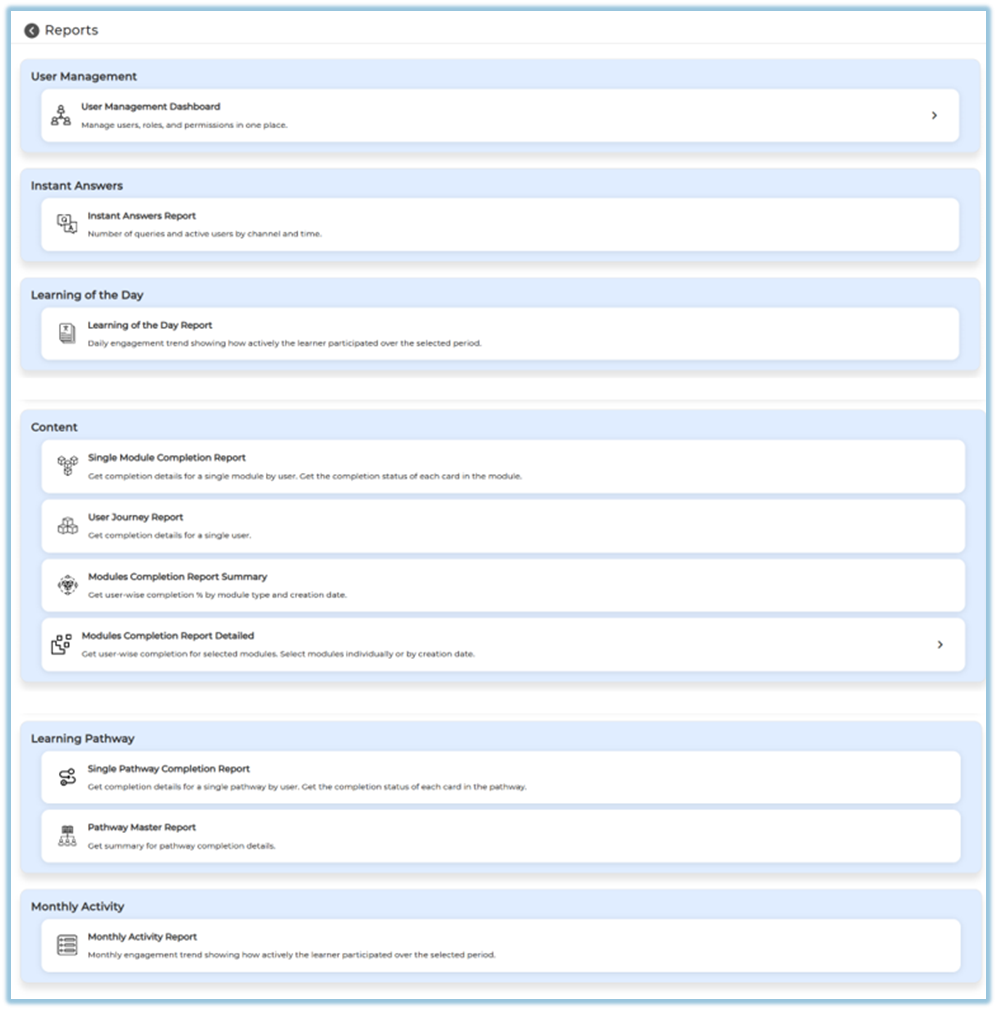
Reports Central is a single page that lists and organizes all available reports in Bsharp Converse, allowing users to quickly navigate to detailed reporting pages based on content, learning pathways, activity, and user engagement.
### **2. When to Use**
- When you want to view learning, content, or engagement reports from one place
- When you need to navigate to a specific report without searching through menus
- When you want to understand which reports are available based on your role
- When you want quick access to summary or detailed report pages
### **3. Concepts**
- **Reports Central Page** – The main landing page that displays all report categories
- **Report Categories** – Logical grouping of reports such as Content, Learning Pathway, and Monthly Activity
- **Report Cards** – Clickable entries that open individual report pages
- **Role-Based Access** – Visibility of reports and tabs based on user permissions
### **4. Set Up Guide**
1. Open the main menu.
2. Click on **Reports**.
3. View the **Reports Central** page.
[https://converse.bsharpcorp.com/celebrate/user-report-page](https://converse.bsharpcorp.com/celebrate/user-report-page)
4. Identify the required report category (for example, Content, Learning Pathway, or Monthly Activity).
5. Select the relevant report card.
6. Open the selected report’s detailed page.
7. View report data based on available filters and dashboards.
8. Use report-specific options such as filters or date ranges if available.
9. Review charts, graphs, and summary cards shown on the report page.
10. View report data based on your access level:
- **Admins** see only the **Company** tab with organization-wide data.
- **Managers, Trainers, and Coaches** see the **Team** tab, which shows the same dashboards but limited to users mapped to them.
### **5. User View**
Users see a categorized list of report cards on the Reports Central page, each showing a short description of the report and opening a detailed reporting view when selected.
### **6. Reporting**
Reports available in **Reports Central** include:
- **User Management Dashboard** – View and manage users, roles, and permissions.
[https://converse.bsharpcorp.com/celebrate/user\_management\_dashboard](https://converse.bsharpcorp.com/celebrate/user_management_dashboard)
- **Instant Answers Report** – Tracks user queries, activity levels, and engagement across Instant Answers channels.
[https://converse.bsharpcorp.com/celebrate/instant\_answers\_report/-1](https://converse.bsharpcorp.com/celebrate/instant_answers_report/-1)
- **Learning of the Day Report** – Tracks daily learner engagement over a selected period.
[https://converse.bsharpcorp.com/celebrate/lotd-insights](https://converse.bsharpcorp.com/celebrate/lotd-insights)
- **User Journey Report** – Shows learning and completion details for a single user.
[https://converse.bsharpcorp.com/celebrate/individual\_user\_reports/21273](https://converse.bsharpcorp.com/celebrate/individual_user_reports/21273)
- **Single Module Completion Report** – Shows completion, scores, ratings, and user activity for a selected module.
[https://converse.bsharpcorp.com/celebrate/learning-module-program-page/learning-module-report/-1](https://converse.bsharpcorp.com/celebrate/learning-module-program-page/learning-module-report/-1)
- **Modules Completion Report Summary** – Displays user-wise module completion percentages by type and creation date.
[https://converse.bsharpcorp.com/celebrate/user\_completion\_report](https://converse.bsharpcorp.com/celebrate/user_completion_report)
- **Modules Completion Report Detailed** – Provides detailed completion data for selected modules.
[https://converse.bsharpcorp.com/celebrate/modules\_completion\_report](https://converse.bsharpcorp.com/celebrate/modules_completion_report)
- **Single Pathway Completion Report** – Shows user completion status for a single learning pathway.
[https://converse.bsharpcorp.com/celebrate/pathway\_individual\_report/0](https://converse.bsharpcorp.com/celebrate/pathway_individual_report/0)
- **Pathway Master Report** – Summarizes completion status across all learning pathways.
[https://converse.bsharpcorp.com/celebrate/pathway\_master\_report](https://converse.bsharpcorp.com/celebrate/pathway_master_report)
- **Monthly Activity Report** – Displays monthly engagement across modules, pathways, instant answers, and LOTD.
[https://converse.bsharpcorp.com/celebrate/monthly\_activity\_report](https://converse.bsharpcorp.com/celebrate/monthly_activity_report)
### **7. Best Practices**
- Use Reports Central as the first step before accessing any detailed report
- Choose the correct report based on whether you need summary or detailed data
- Verify your role-based access to understand whether Company or Team data is shown
### **8. Related Links / FAQs**
- [**User Management Dashboard Report**](https://help.bsharpcorp.com/books/reports/page/user-management-dashboard-report)
- [**Instant Answers Report**](https://help.bsharpcorp.com/books/reports/page/instant-answers-report)
- [**Learning of the Day Report**](https://help.bsharpcorp.com/books/reports/page/learning-of-the-day-report)
- [**Single Module Completion Report**](https://help.bsharpcorp.com/books/reports/page/single-module-completion-report)
- [**User Journey Report**](https://help.bsharpcorp.com/books/reports/page/user-activity-dashboard)
- [**Modules Completion Report Summary**](https://help.bsharpcorp.com/books/reports/page/modules-completion-report-summary)
- [**Modules Completion Report Detailed**](https://help.bsharpcorp.com/books/reports/page/modules-completion-report-detailed)
- [**Single Pathway Completion Report**](https://help.bsharpcorp.com/books/reports/page/single-pathway-completion-report)
- [**Pathway Master Report**](https://help.bsharpcorp.com/books/reports/page/learning-pathway-master-report)
- [**Monthly Activity Report**](https://help.bsharpcorp.com/books/reports/page/monthly-activity-report)
**Q: Can all users see all reports?**
A: No. Report visibility and tabs depend on the user’s role and assigned permissions.
### **9. Version Notes**
Last Updated: 7 Jan 2026
# Form Responses Report
### **1. Overview**
Form Reports in Bsharp Converse allow administrators and authorized users to view, analyze, and download responses submitted for published forms. Reports provide visibility into user participation, submission trends, question-level responses, and media collected through forms.
### **2. When to Use**
Use this when:
- You want to view responses submitted for a published form.
- You need to analyze form data by date range, user, or attributes.
- You want to download responses or media collected through a form.
- You need to monitor form usage at company or team level.
### **3. Concepts**
- **Form Reports** – The reporting view that displays response data for a selected form.
- **Company Tab** – Shows reports across the organization and is accessible to administrators.
- **Team Tab** – Shows reports for assigned teams and is accessible to users with team-level permissions.
- **Filters** – Options used to narrow report data by time range, user, or attributes.
- **Question-level Data** – Response data displayed for individual questions within a form.
### **4. Set Up Guide**
1. Open the **Forms** section.
2. Select a **published form** from the form list.
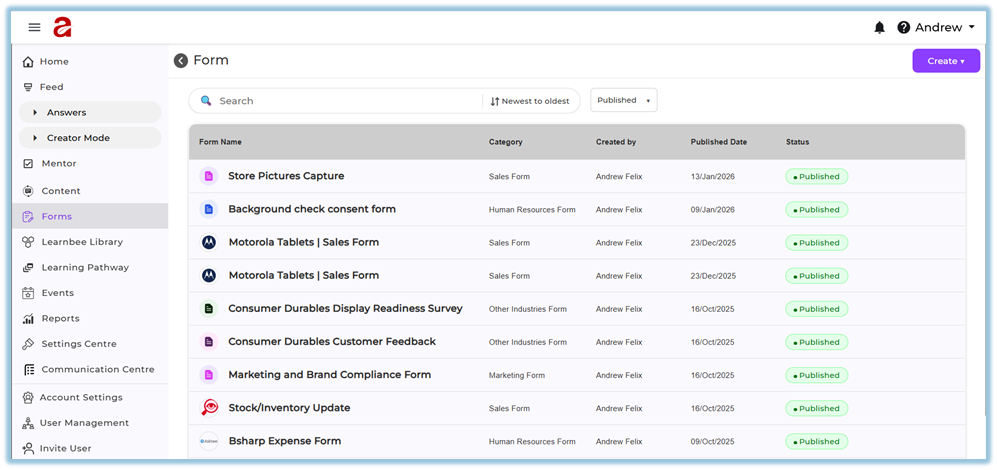
3. Navigate to the **Manage** page of the form.
4. Click **Reports**.
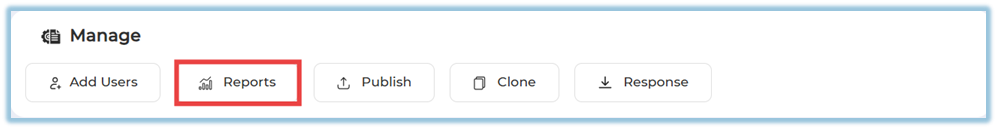
5. The **Form Report** page opens.
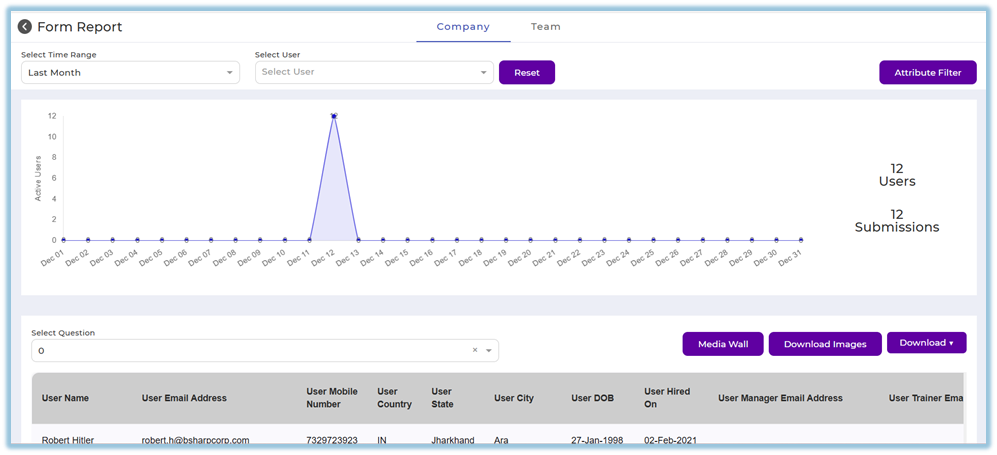
##### **Filter report data**
6. Select a **Time Range** to filter responses.
7. Select a **User** to view responses for a specific user.
8. Click **Reset** to clear applied filters.
9. Use **Attribute Filter** to filter responses based on assigned attributes.
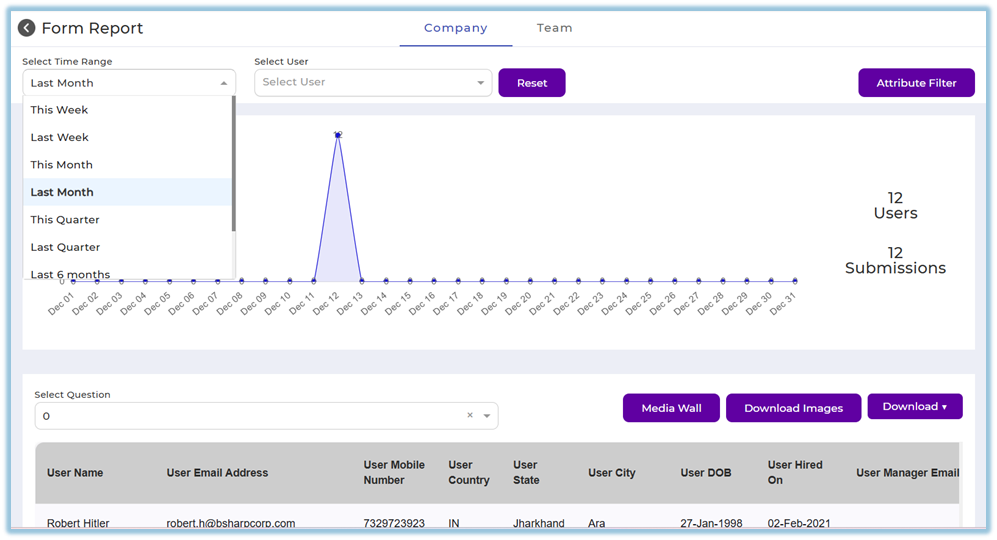
##### **View report data**
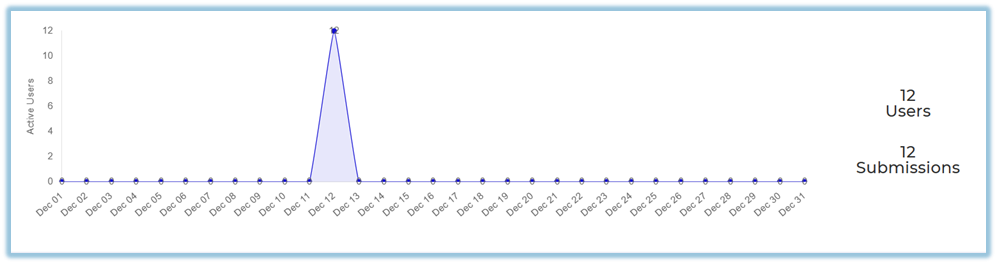
10. View submission trends displayed in the report graph.
11. Review **Active Users** and **Submissions** count.
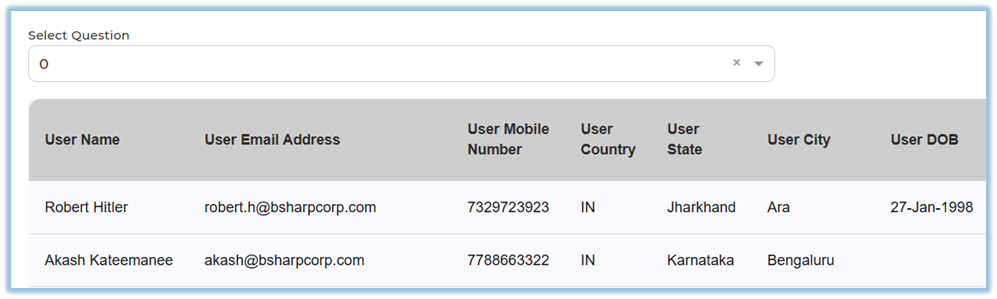
12. Select a **Question** to view question-specific response data.
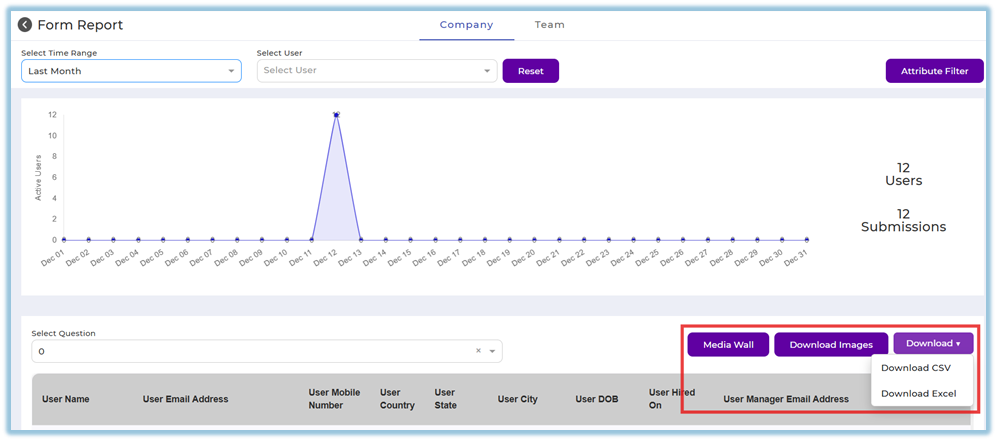
##### **Download report data**
13. Use **Media Wall** to view image-based responses.
14. Click **Download Images** to download uploaded images.
15. Use **Download** to export responses in available formats such as CSV or Excel.
### **5. User View**
Form Reports are visible only to users with appropriate access. Administrators can view reports across the company, while team-level users can view reports limited to their assigned teams.
### **6. Reporting**
- Reports are available only after a form is published.
- **Company tab** is accessible to administrators.
- **Team tab** is accessible to users with team-level roles such as managers or trainers.
- Reports reflect real-time data as users submit responses.
### **7. Best Practices**
- Apply filters to narrow down large data sets.
- Use question-level filtering to analyze specific responses.
- Download data periodically for offline analysis.
- Use Media Wall for reviewing image-based submissions.
- Ensure users are assigned before expecting report data.
### **8. Version Notes**
Last Updated: 14 Jan 2026
# Converse AI Reports
### **1. Overview**
Converse AI Reports is a reporting interface within Bsharp Converse that allows administrators to generate reports by asking questions in natural language. It presents results in multiple formats such as text, tables, KPIs, charts, and dashboards, enabling quick access to learning and activity data through a conversational interface.
### **2. When to Use**
- When you want to generate reports without manually configuring report fields.
- When you need quick insights into users, modules, completions, points, or learning activity.
- When you want to visualize report data using tables, charts, or KPI widgets.
- When you want to save frequently used reports as dashboards for reuse.
### **3. Concepts**
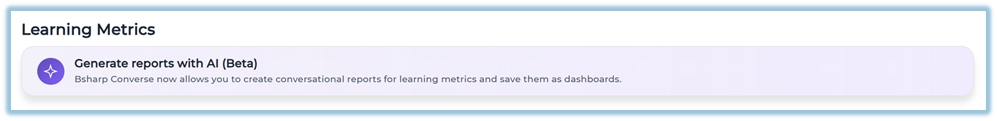
- **Generate reports with AI (Beta)** – Entry point under Reports to access the AI reporting interface.
- **Natural-language query** – A plain English question used to request report data.
- **Response types** – Output formats such as text, table, KPI, or chart.
- **Table controls** – Options to manage rows displayed and export data.
- **Dashboards** – Saved collections of report widgets.
- **Widgets** – Individual report outputs added to dashboards.
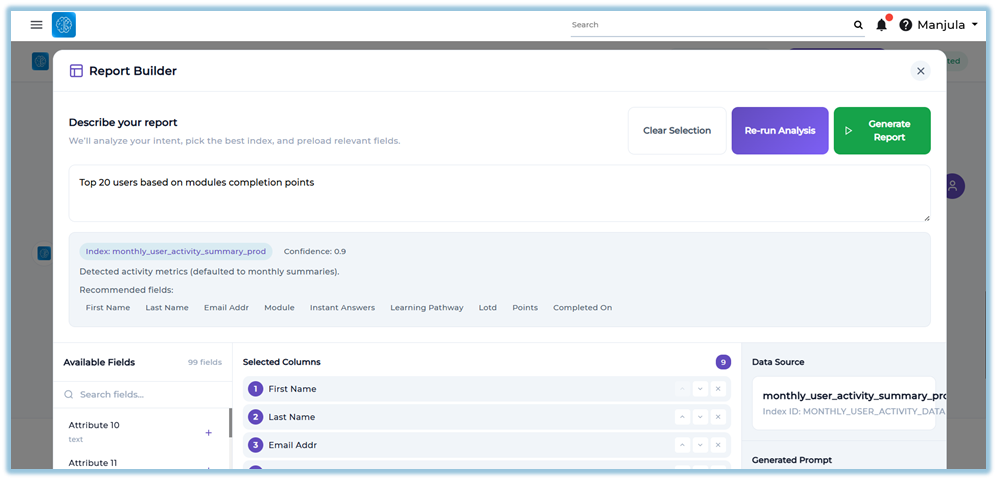
- **Report Builder** – A visual interface for building structured reports using fields and filters.
- **Connection status** – Indicator showing whether the reporting backend is connected.
### **4. Set Up Guide**
1. Click the three-line main menu from the homepage.
2. Click **Reports** to open the Reports landing page.
3. Under **Learning Metrics**, click **Generate reports with AI (Beta)**.
[https://converse.bsharpcorp.com/celebrate/user-report-page](https://converse.bsharpcorp.com/celebrate/user-report-page)
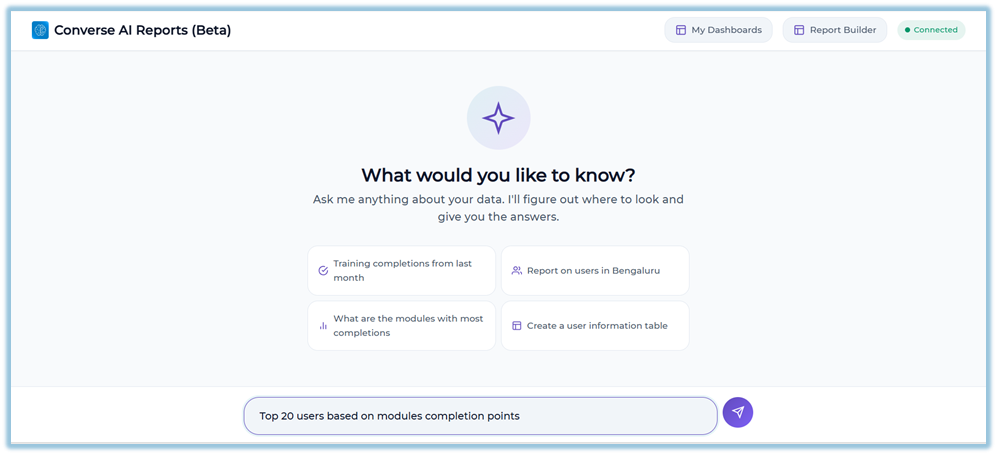
4. The **Converse AI Reports (Beta)** page opens with a chat-style interface.
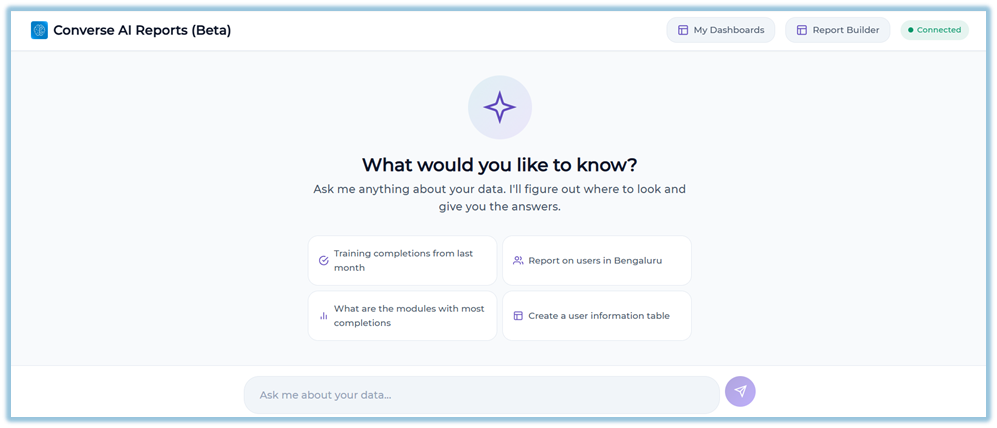
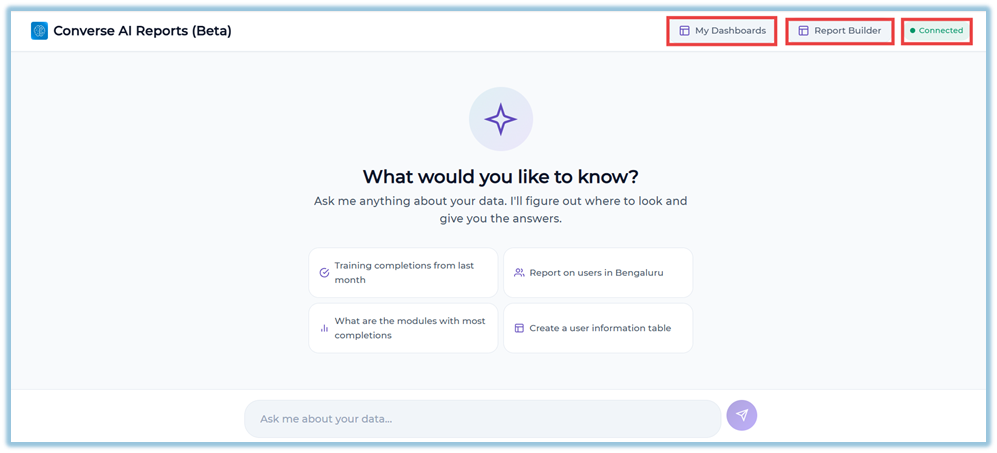
5. Review the header section, which displays **My Dashboards**, **Report Builder**, and the **Connection status** indicator.
6. Locate the input field labeled **“Ask me about your data…”** at the bottom of the screen.
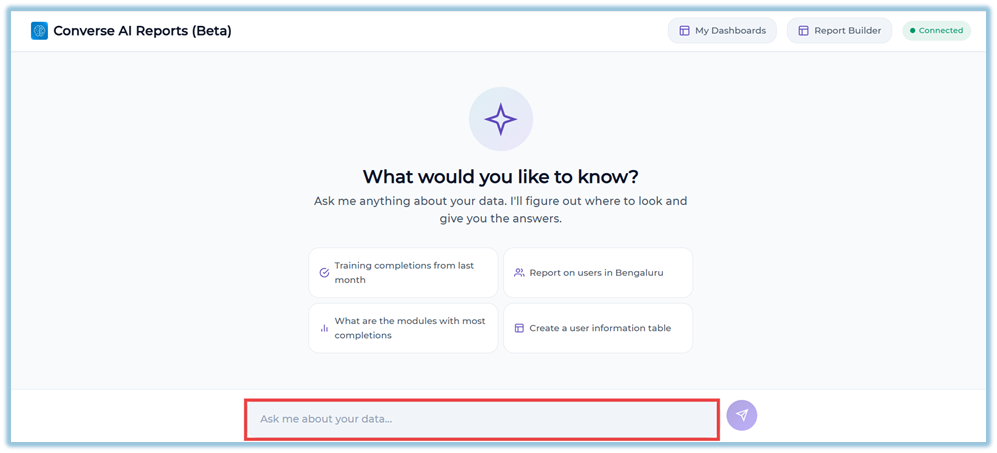
7. Type a natural-language question describing the report you want to generate.
- Example: *Top 20 users based on modules completion points*
8. Press **Enter** or click the **Send** button to submit the query.
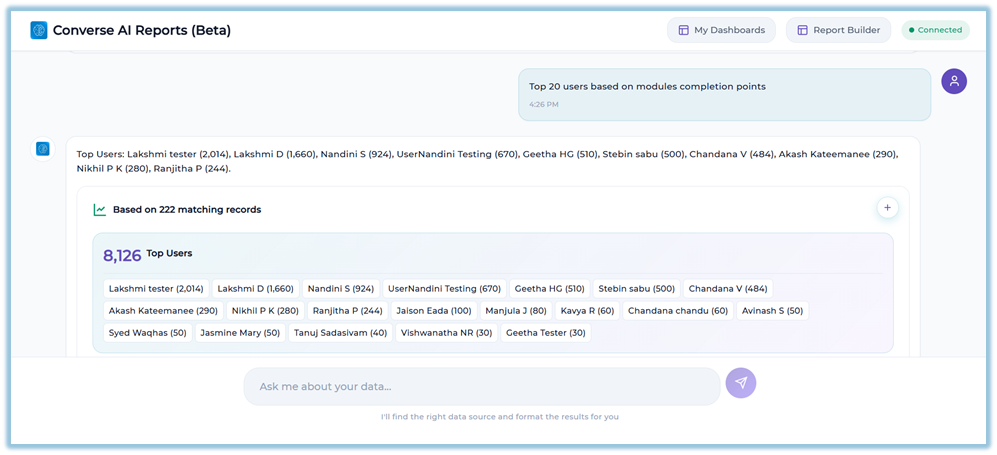
9. View the response generated by the system in the chat area.
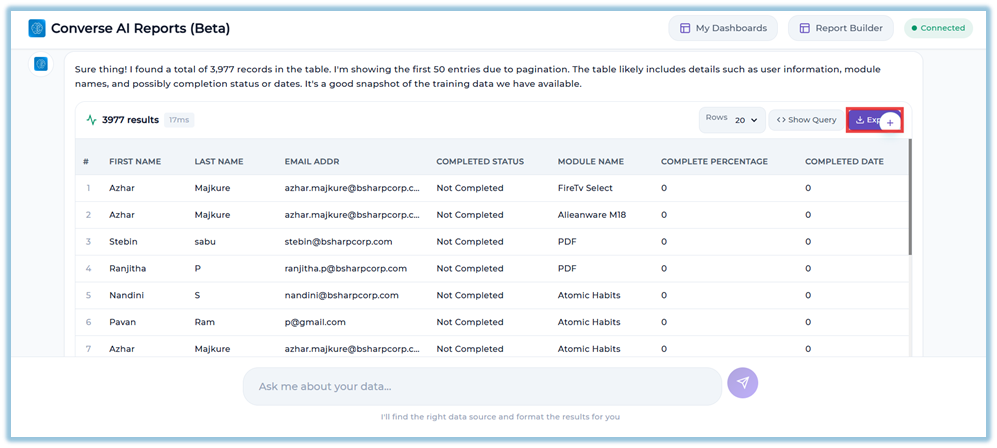
10. If the response appears as a table, use the **Rows** dropdown to change the number of rows displayed.
11. Click **Export** to download the full dataset as a CSV file, if required.
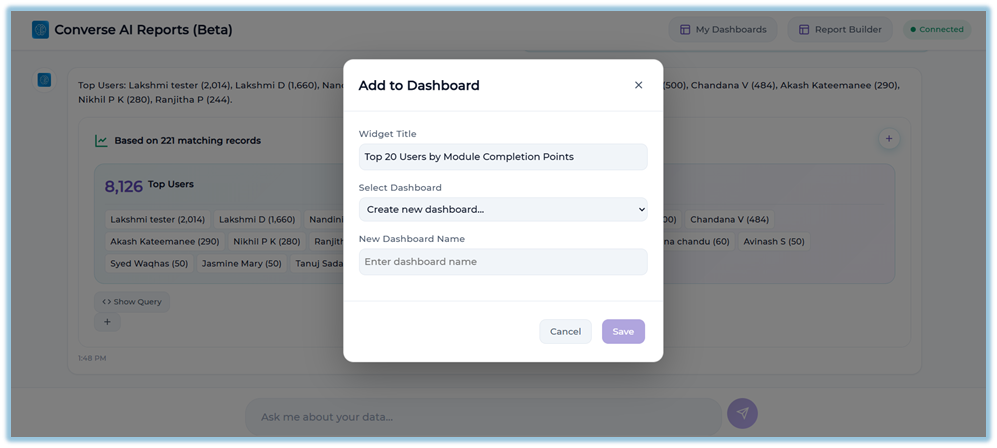
12. Click the **+ Add to Dashboard** icon on the result to save the output as a dashboard widget.
13. In the **Add to Dashboard** window, enter a **Widget Title**, select an existing dashboard or choose **Create new dashboard…**, and click **Save**.
14. To build a structured report visually, click **Report Builder** from the header.
15. In **Report Builder**, enter a report description and click **Analyze Intent** to load relevant fields.
16. Review and adjust **Selected Columns**, **Report Context (Mega Filter)**, **Additional Filters**, and **Sort By** options.
17. Click **Generate Report** to return the result to the chat view.
### **5. User View**
Users see a chat-based interface where their questions appear on the right side and system responses appear on the left. Responses may be displayed as text, tables, KPI cards, or charts. Each response includes timestamps and interaction controls such as export or add-to-dashboard options, depending on the output type.
### **6. Reporting**
**Converse AI Reports** provides multiple reporting outputs based on the type of question asked.
##### Report Output Types
- **Text Response**
Displays conversational explanations for descriptive or summary queries.
- **Table**
Shows structured data in rows and columns.
- Includes a results count and response time.
- Supports row size selection using the **Rows** dropdown.
- Allows exporting the complete dataset using **Export** (CSV).
- **KPI Widget**
Displays a single metric as a numeric value with a label.
- **Multi-KPI View**
Displays multiple related metrics as a group of KPI cards.
- **Charts**
Visualizes trends or breakdowns using **Bar**, **Pie**, **Line**, or **Doughnut** charts.
- Chart types can be switched using toggle buttons.
- Tooltips appear on hover to show values and context.
- Legends and axes are displayed where applicable.
- **Aggregation Cards**
Summarize grouped data with supporting visuals and record counts.
##### Dashboard Reporting
- Any table, chart, or KPI output can be saved as a **widget** using the **+ Add to Dashboard** option.
- Widgets can be added to an existing dashboard or saved to a new dashboard.
- Saved dashboards are accessed from **My Dashboards**.
- Inside a dashboard, widgets can be refreshed, downloaded, repositioned, or resized.
- Table widgets within dashboards support pagination, page size selection, and CSV downloads.
##### Data Export
- Table results in the chat view can be exported using **Export**.
- Dashboard widgets include a **Download** option where applicable.
- Exports always include the full dataset, not just visible rows.
### **7. Best Practices**
- Use clear and specific natural-language questions for better results.
- Review response formats to choose the most suitable visualization.
- Save frequently used reports as dashboards for quicker access.
- Refresh dashboard widgets to ensure updated data is displayed.
### **8. Related Links / FAQs**
**Can I export data from Converse AI Reports?**
Yes. Table results and dashboard widgets include an option to download data as CSV files.
**What does the connection status indicate?**
The connection status shows whether the reporting backend is reachable. Queries may fail if the status is disconnected.
### **9. Version Notes**
Last Updated: 10 Feb 2026