# Classroom Sessions Report
### **1. Overview**
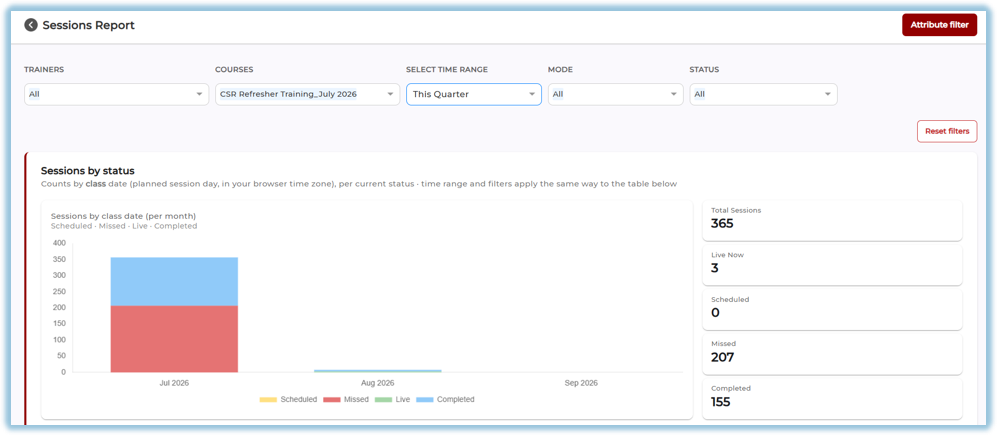
The **Sessions Report** provides detailed insights into classroom sessions conducted within the platform. It enables administrators to monitor session status, attendance, learner participation, trainer performance, and course progress through interactive dashboards and detailed reports.
### **2. When to Use**
Use the **Sessions Report** to:
- Monitor classroom session performance.
- Track attendance and learner participation.
- View trainer-wise and course-wise session statistics.
- Analyze learner engagement.
- Download session reports for further analysis.
### **3. Concepts**
- **Sessions by Status** – Displays the number of sessions based on their current status.
- **Attendance Funnel** – Shows learner participation from invitation to session rating.
- **Session-Level Report** – Displays detailed information for individual classroom sessions.
- **Trainer-Level Report** – Summarizes classroom performance for each trainer.
- **Course-Level Report** – Provides consolidated statistics for each classroom course.
- **Learner-Level Report** – Displays learner participation and completion details across classroom sessions.
### **4. Setup Guide**
##### Accessing the Sessions Report
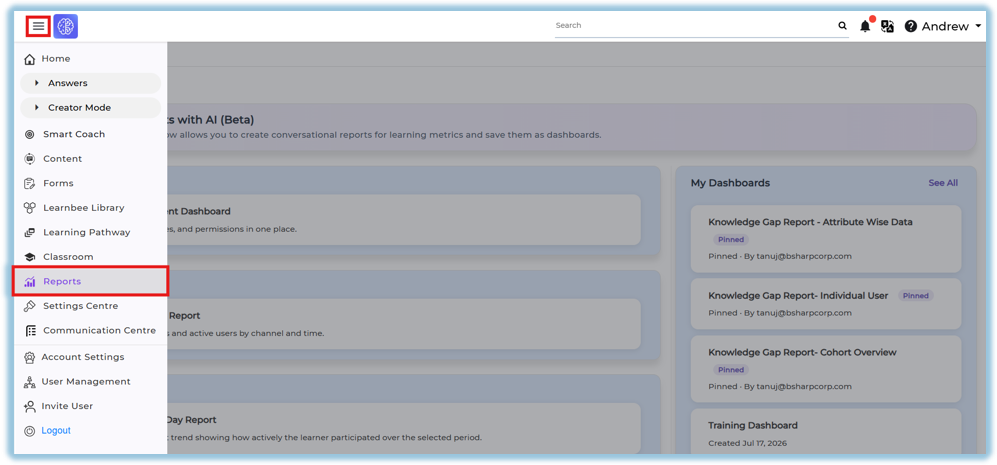
1. Click the **Main Menu**.
2. Select **Reports**.
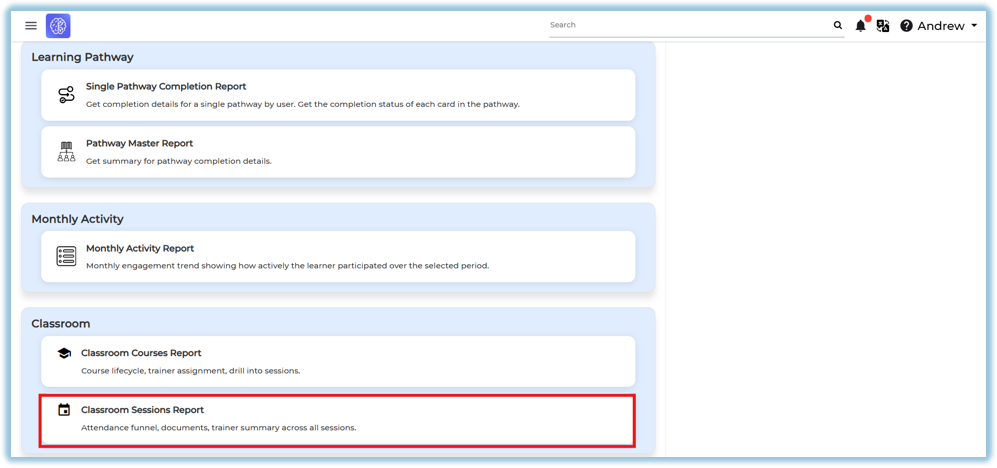
3. Open **Classroom Reports**.
##### Apply Filters
Use the available filters to refine the report:
- **Trainer**
- **Courses**
- **Time Range**
- **Mode**
- **Status**
- **Attribute Filter
**
Click **Reset Filters** to clear all applied filters.
### **5. User View**
##### Sessions by Status
Displays a graphical overview of classroom sessions categorized as:
- Scheduled
- Live
- Completed
- Missed
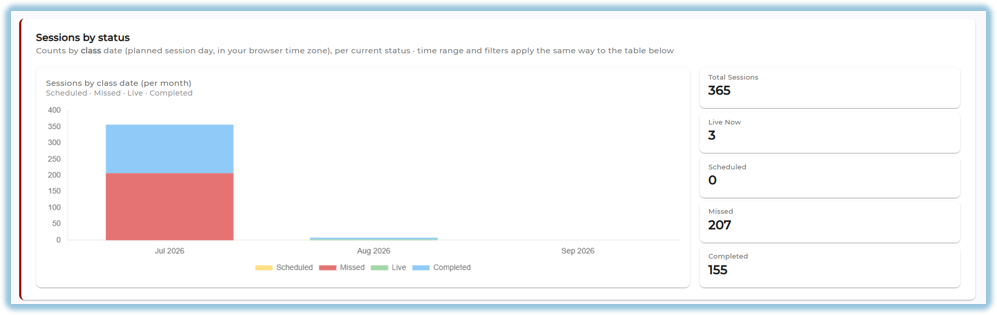
The chart updates automatically based on the selected filters.
##### Summary Cards
The dashboard displays the following session statistics:
- Total Sessions
- Live Now
- Scheduled
- Missed
- Completed
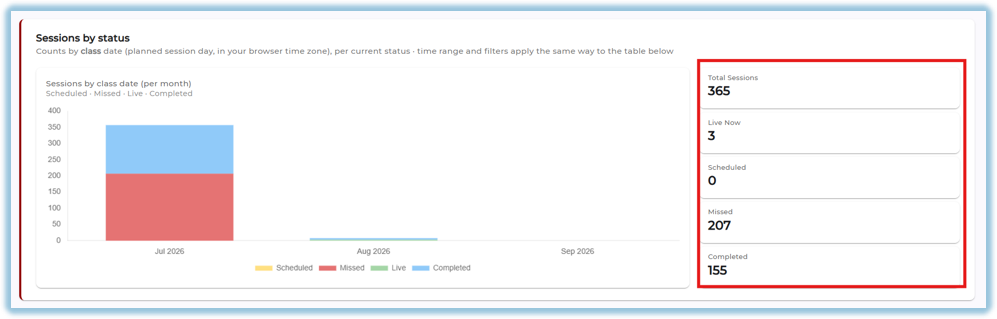
These cards provide a quick summary of classroom session activity.
##### Attendance Funnel
The Attendance Funnel tracks learner participation throughout the classroom session lifecycle.
It displays:
- Invited
- Accepted
- Attended
- Rated
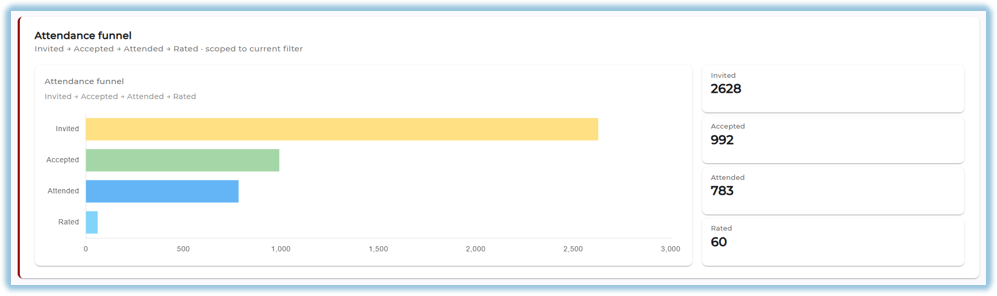
This section helps administrators understand learner engagement and attendance trends.
##### Session-Level Report
Displays detailed information for every classroom session.
The report includes:
- Trainer
- Session ID
- Session Name
- Course Name
- Date
- Time
- Mode
- Venue/Link
- Session Status
- Invited
- Accepted
- Attended
- Learnbee Completion
- Quiz Completion
- Poll Completion
- Rating
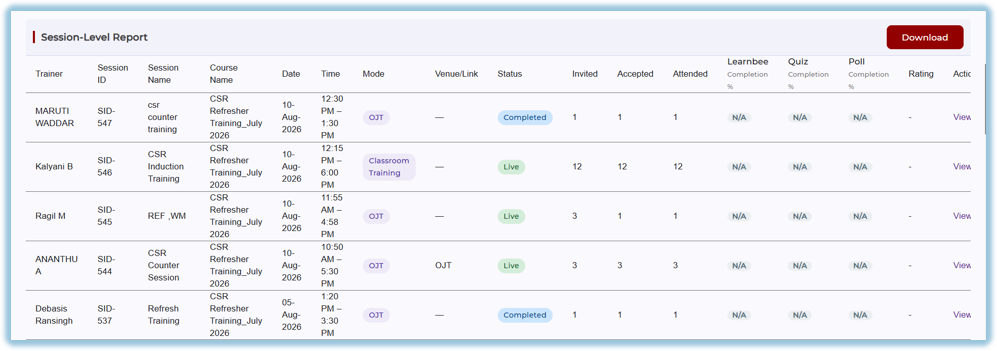
Use **View Report** to open detailed information for a specific session.
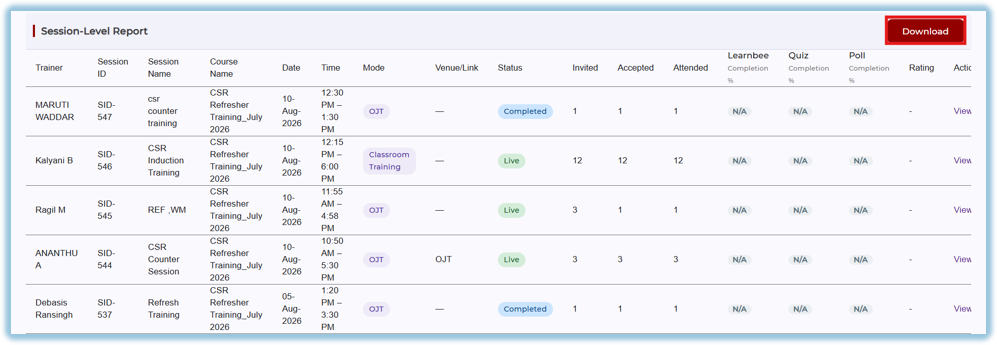
Click **Download** to export the Session-Level Report.
##### Trainer-Level Report
Displays classroom performance for each trainer.
The report includes:
- Trainer Name
- Total Courses
- Total Sessions
- Live Sessions
- Scheduled Sessions
- Missed Sessions
- Completed Sessions
- Total Invited
- Total Accepted
- Total Attended
- Average Quiz Score
- Average Poll Score
- Average Rating
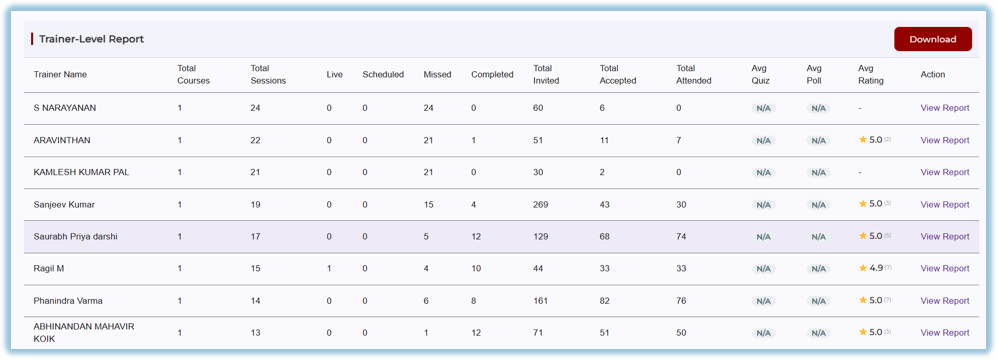
Click **View Report** to view trainer-specific session details.
Click **Download** to export the report.
##### Course-Level Report
Displays consolidated classroom statistics for each course.
The report includes:
- Course Name
- Total Sessions
- Total Trainers
- Live
- Scheduled
- Missed
- Completed
- Total Invited
- Total Accepted
- Total Attended
- Average Rating

Click **View Report** to open detailed course statistics.
Click **Download** to export the report.
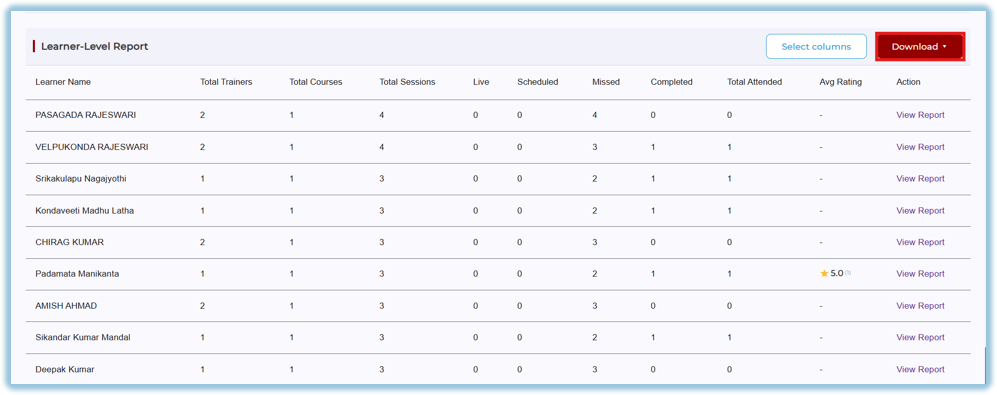
##### Learner-Level Report
Displays learner participation across classroom sessions.
The report includes:
- Learner Name
- Total Trainers
- Total Courses
- Total Sessions
- Live
- Scheduled
- Missed
- Completed
- Total Attended
- Average Rating
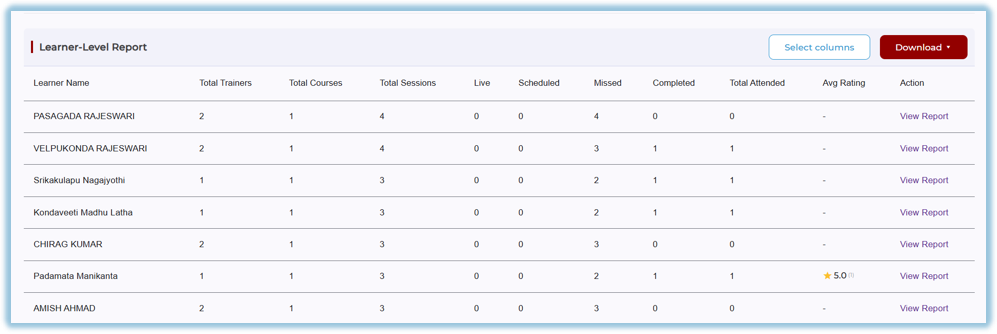
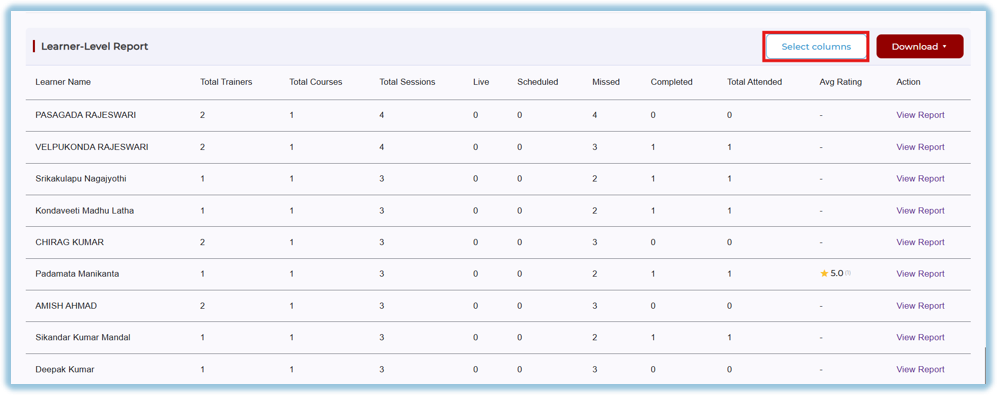
Use **Select Columns** to customize the displayed columns.
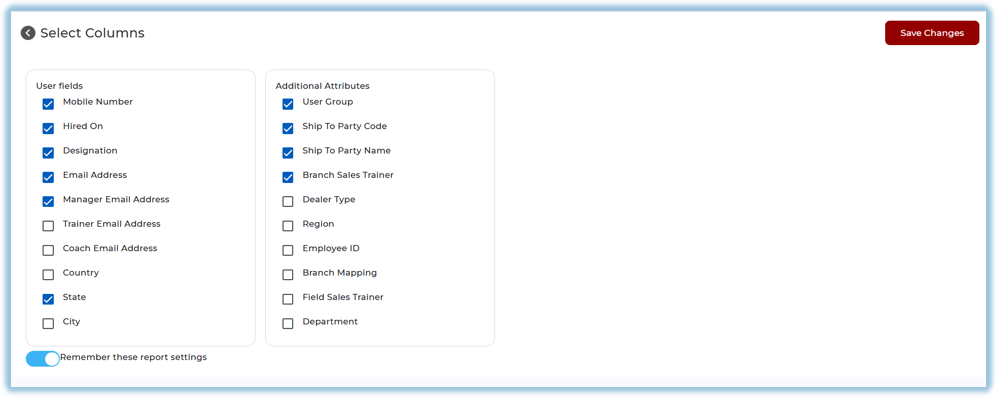
Click **View Report** to view learner-specific details.
Click **Download** to export the report.
### **6. Reporting**
The Sessions Report enables administrators to:
- Monitor classroom session performance.
- Analyze attendance and learner engagement.
- Review trainer performance.
- Track course progress.
- Generate detailed reports at the session, trainer, course, and learner levels.
- Export reports for analysis and record keeping.
### **7. Best Practices**
- Apply filters before analyzing reports.
- Regularly monitor missed sessions and attendance trends.
- Review trainer performance to improve classroom delivery.
- Use learner reports to identify participation gaps.
- Download reports periodically for auditing and performance tracking.
### **8. Troubleshooting & FAQs**
**Why are no sessions displayed?**
Verify that the selected filters match available classroom data.
**Why are attendance counts different?**
Attendance statistics are updated based on learner participation and session completion.
**Why can't I view a report?**
Ensure you have permission to access Classroom Reports and that data exists for the selected filters.
**How do I customize the Learner-Level Report?**
Click **Select Columns**, choose the required fields, and save your changes.
### **9. Related Links**
- [Courses Report](https://converse.bsharpcorp.com/classroom/reports/courses)
- [Classroom](https://converse.bsharpcorp.com/classroom/admin/courses)
- [Reports](https://converse.bsharpcorp.com/user-management/user-report-page)
### **10. Version Notes**
Last Updated: 10 Aug 2026