# Converse AI Reports
### **1. Overview**
Converse AI Reports is a reporting interface within Bsharp Converse that allows administrators to generate reports by asking questions in natural language. It presents results in multiple formats such as text, tables, KPIs, charts, and dashboards, enabling quick access to learning and activity data through a conversational interface.
### **2. When to Use**
- When you want to generate reports without manually configuring report fields.
- When you need quick insights into users, modules, completions, points, or learning activity.
- When you want to visualize report data using tables, charts, or KPI widgets.
- When you want to save frequently used reports as dashboards for reuse.
### **3. Concepts**
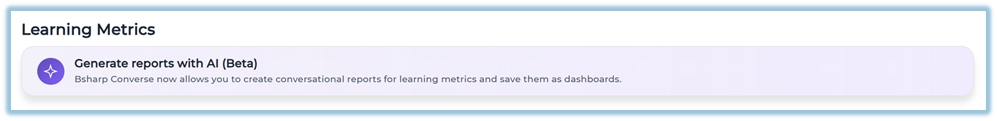
- **Generate reports with AI (Beta)** – Entry point under Reports to access the AI reporting interface.
- **Natural-language query** – A plain English question used to request report data.
- **Response types** – Output formats such as text, table, KPI, or chart.
- **Table controls** – Options to manage rows displayed and export data.
- **Dashboards** – Saved collections of report widgets.
- **Widgets** – Individual report outputs added to dashboards.
- **Report Builder** – A visual interface for building structured reports using fields and filters.
- **Connection status** – Indicator showing whether the reporting backend is connected.
### **4. Set Up Guide**
1. Click the three-line main menu from the homepage.
2. Click **Reports** to open the Reports landing page.
3. Under **Learning Metrics**, click **Generate reports with AI (Beta)**.
[https://converse.bsharpcorp.com/celebrate/user-report-page](https://converse.bsharpcorp.com/celebrate/user-report-page)
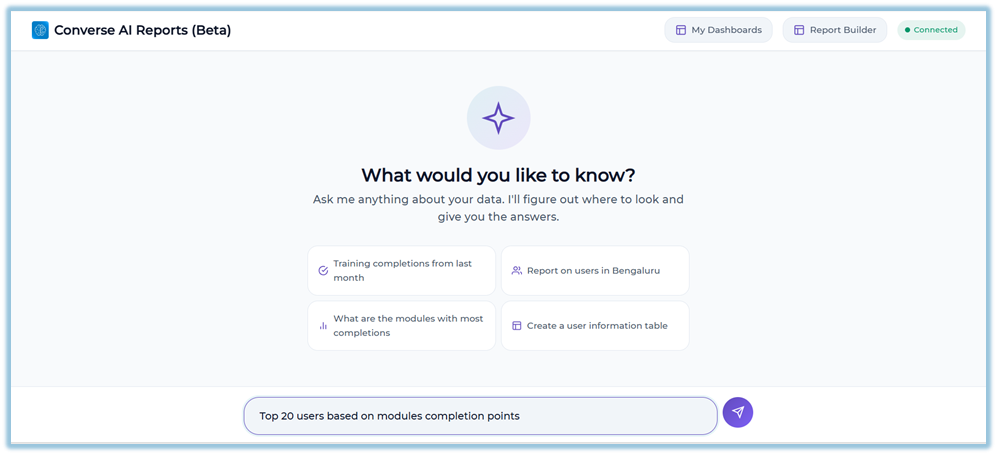
4. The **Converse AI Reports (Beta)** page opens with a chat-style interface.
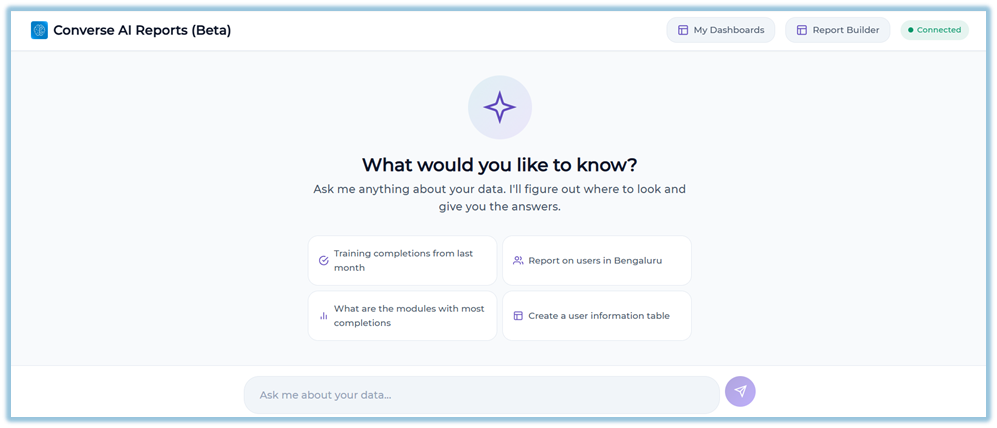
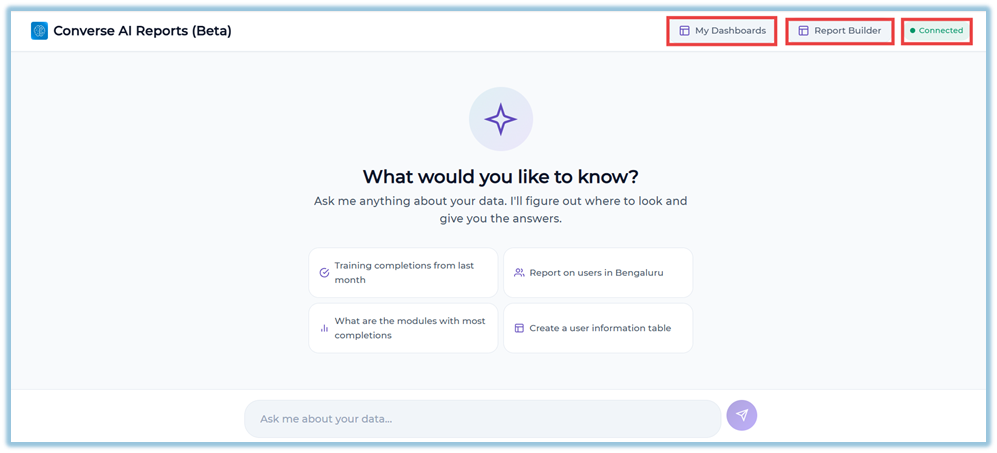
5. Review the header section, which displays **My Dashboards**, **Report Builder**, and the **Connection status** indicator.
6. Locate the input field labeled **“Ask me about your data…”** at the bottom of the screen.
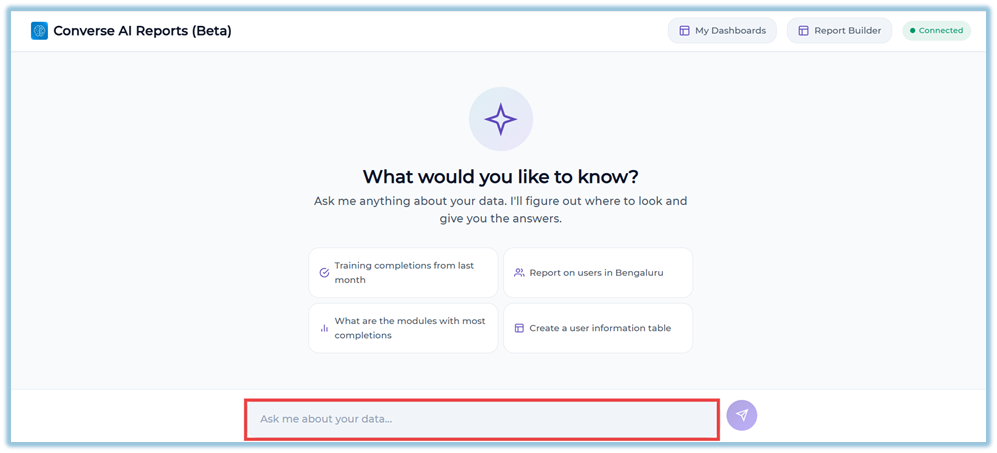
7. Type a natural-language question describing the report you want to generate.
- Example: *Top 20 users based on modules completion points*
8. Press **Enter** or click the **Send** button to submit the query.
9. View the response generated by the system in the chat area.
10. If the response appears as a table, use the **Rows** dropdown to change the number of rows displayed.
11. Click **Export** to download the full dataset as a CSV file, if required.
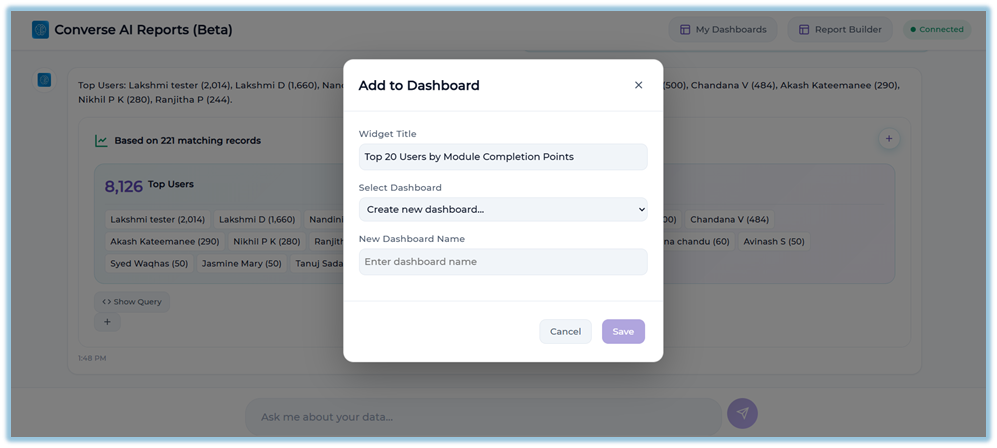
12. Click the **+ Add to Dashboard** icon on the result to save the output as a dashboard widget.
13. In the **Add to Dashboard** window, enter a **Widget Title**, select an existing dashboard or choose **Create new dashboard…**, and click **Save**.
14. To build a structured report visually, click **Report Builder** from the header.
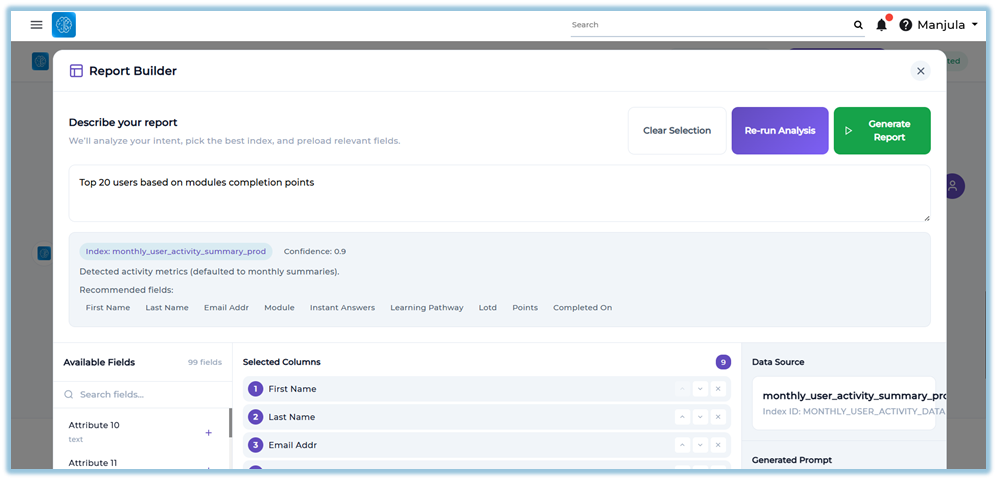
15. In **Report Builder**, enter a report description and click **Analyze Intent** to load relevant fields.
16. Review and adjust **Selected Columns**, **Report Context (Mega Filter)**, **Additional Filters**, and **Sort By** options.
17. Click **Generate Report** to return the result to the chat view.
### **5. User View**
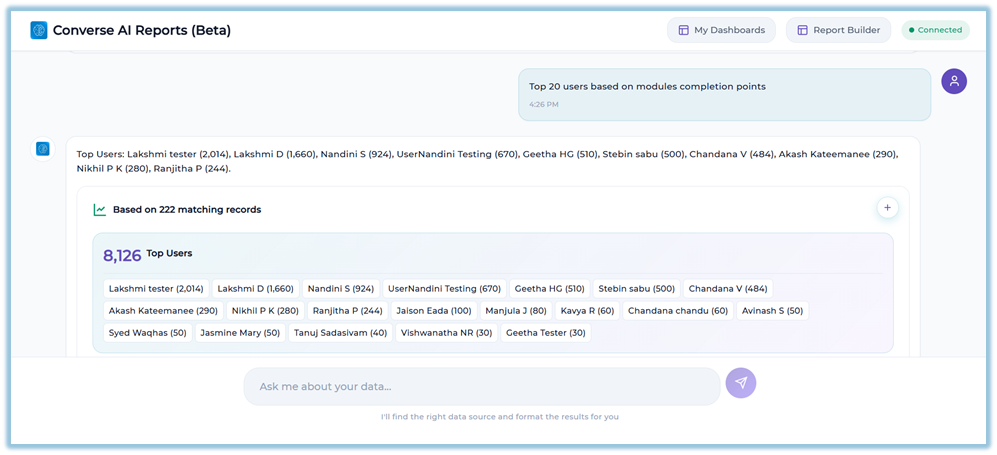
Users see a chat-based interface where their questions appear on the right side and system responses appear on the left. Responses may be displayed as text, tables, KPI cards, or charts. Each response includes timestamps and interaction controls such as export or add-to-dashboard options, depending on the output type.
### **6. Reporting**
**Converse AI Reports** provides multiple reporting outputs based on the type of question asked.
##### Report Output Types
- **Text Response**
Displays conversational explanations for descriptive or summary queries.
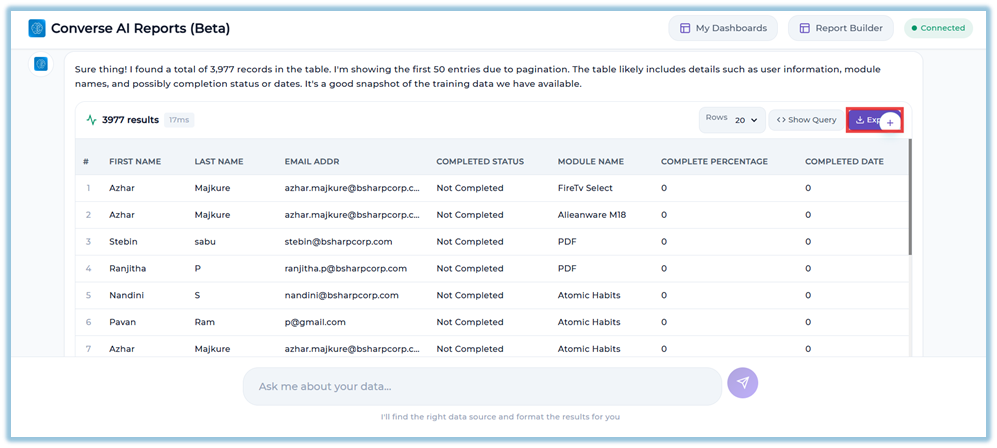
- **Table**
Shows structured data in rows and columns.
- Includes a results count and response time.
- Supports row size selection using the **Rows** dropdown.
- Allows exporting the complete dataset using **Export** (CSV).
- **KPI Widget**
Displays a single metric as a numeric value with a label.
- **Multi-KPI View**
Displays multiple related metrics as a group of KPI cards.
- **Charts**
Visualizes trends or breakdowns using **Bar**, **Pie**, **Line**, or **Doughnut** charts.
- Chart types can be switched using toggle buttons.
- Tooltips appear on hover to show values and context.
- Legends and axes are displayed where applicable.
- **Aggregation Cards**
Summarize grouped data with supporting visuals and record counts.
##### Dashboard Reporting
- Any table, chart, or KPI output can be saved as a **widget** using the **+ Add to Dashboard** option.
- Widgets can be added to an existing dashboard or saved to a new dashboard.
- Saved dashboards are accessed from **My Dashboards**.
- Inside a dashboard, widgets can be refreshed, downloaded, repositioned, or resized.
- Table widgets within dashboards support pagination, page size selection, and CSV downloads.
##### Data Export
- Table results in the chat view can be exported using **Export**.
- Dashboard widgets include a **Download** option where applicable.
- Exports always include the full dataset, not just visible rows.
### **7. Best Practices**
- Use clear and specific natural-language questions for better results.
- Review response formats to choose the most suitable visualization.
- Save frequently used reports as dashboards for quicker access.
- Refresh dashboard widgets to ensure updated data is displayed.
### **8. Related Links / FAQs**
**Can I export data from Converse AI Reports?**
Yes. Table results and dashboard widgets include an option to download data as CSV files.
**What does the connection status indicate?**
The connection status shows whether the reporting backend is reachable. Queries may fail if the status is disconnected.
### **9. Version Notes**
Last Updated: 10 Feb 2026