# Instant Answers Report
### **1. Overview**
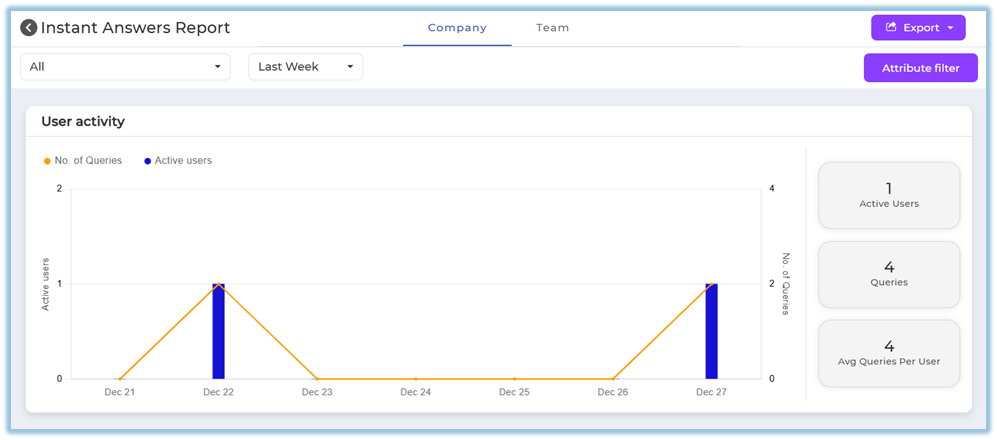
The **Instant Answers Report** provides insights into how users interact with Instant Answers channels across the platform. It helps track user engagement by showing the number of queries raised, active users, and usage trends over a selected period.
The report supports both **organization-level monitoring** and **team-level visibility**, depending on the user’s role and access.
### **2. When to Use**
Use the Instant Answers Report when you want to:
- Monitor overall adoption of Instant Answers across the organization
- Understand how frequently users are raising queries
- Track active users over time
- Analyze usage trends by channel and time period
- Review engagement at a team level for Managers, Trainers, and Mentors
- Export data for analysis and review
### **3. Concepts**
- **Instant Answers Channel**
A configured knowledge channel used by users to raise queries and receive instant responses.
- **Active Users**
Users who have raised at least one query during the selected timeline.
- **Queries**
Total number of questions raised by users in Instant Answers.
- **Average Queries per User**
Average number of queries raised per active user.
- **Company Tab**
Organization-wide view available to Admin users.
- **Team Tab**
Restricted view available only to Managers, Trainers, and Mentors for their mapped users.
- **Attribute Filters**
Filters that allow report data to be refined using user attributes such as designation, department, country, manager, trainer, mentor, etc.
### **4. Set Up Guide**
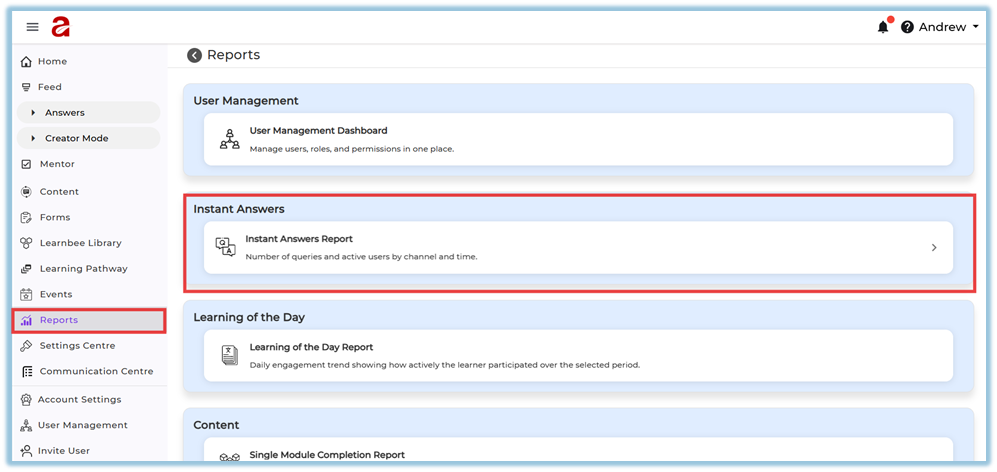
1. Open the main navigation menu from the homepage.
2. Navigate to the **Reports** section.
3. Click on **Instant Answers Report**.
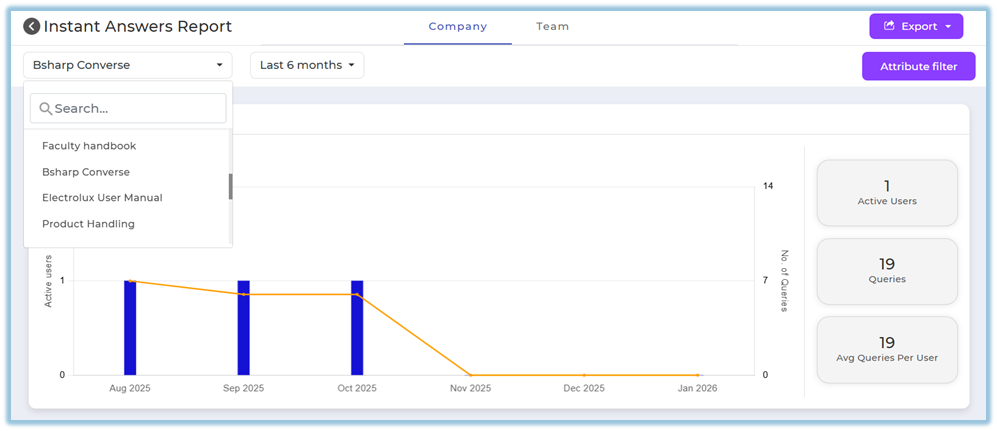
4. View the list of all configured Instant Answers channels displayed in the report.
5. Select a time range such as:
- This week
- Last week
- This month
- Last month
- This quarter
- Last quarter
- Last six months
- Last 12 months
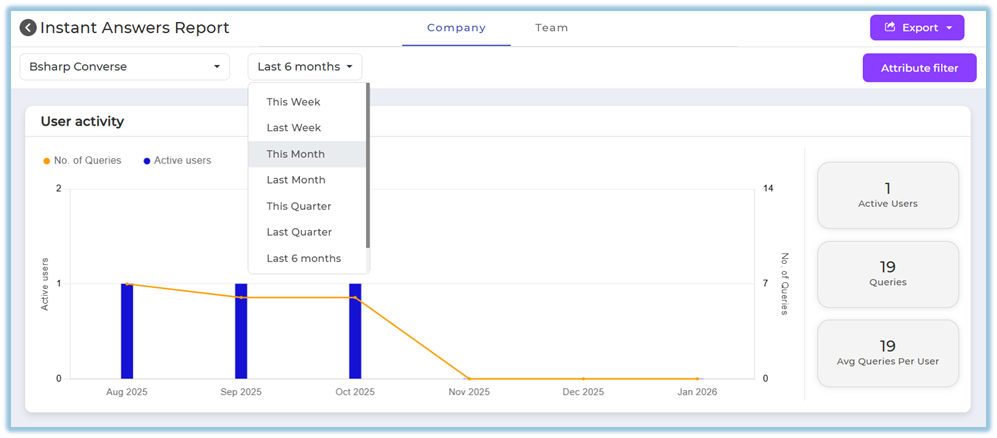
6. Review the dashboard data updated based on the selected time range.
7. Click **Attribute Filter** to refine the report using user attributes such as:
- Designation
- Department
- Country
- Coach email
- Trainer email
- Manager email
- State
- City
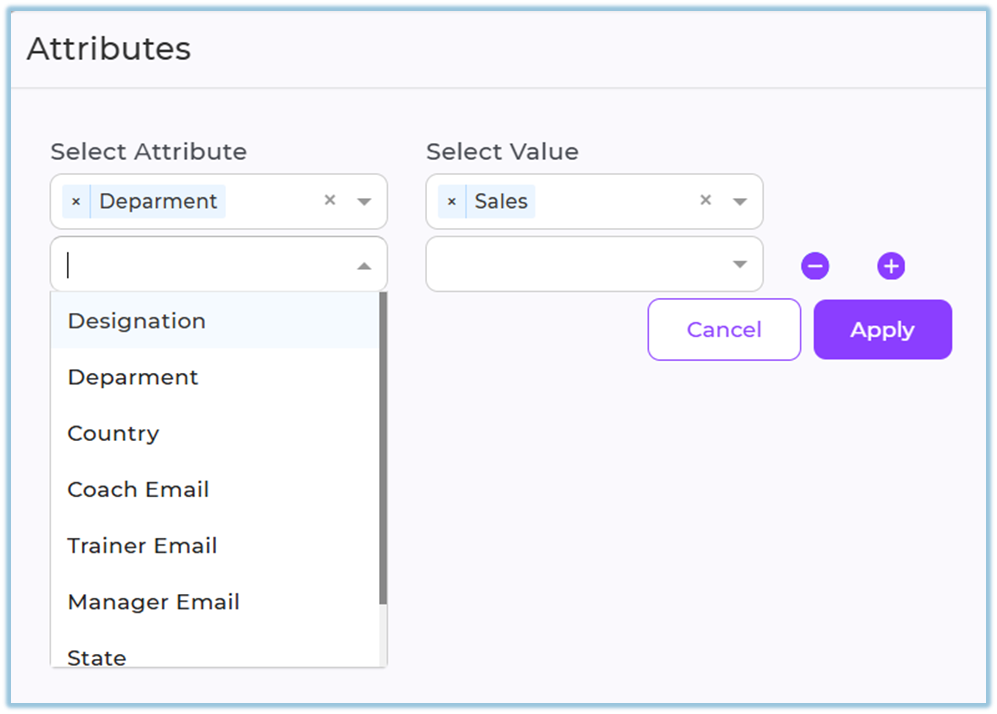
8. Select the required attribute values and apply the filter to update the dashboard.
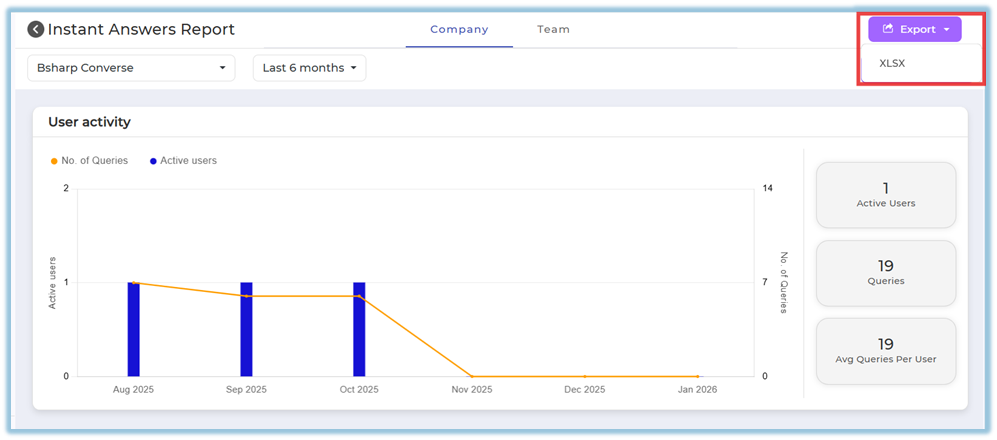
9. Click **Export** to download the filtered report as an Excel file.
### **5. User View**
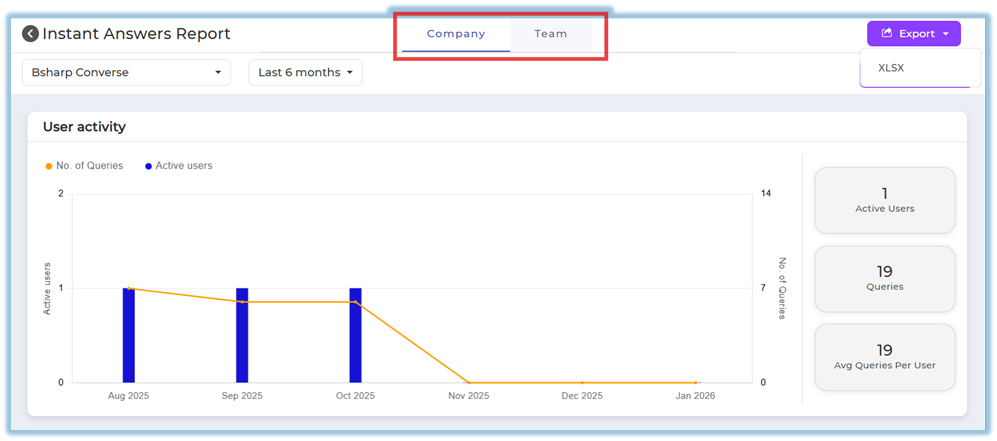
Admins can see only the **Company** tab by default, which displays Instant Answers usage across all users and channels.
If an admin is also assigned as a manager, trainer, or mentor, they can additionally see the **Team** tab.
Managers, trainers, and mentors see the **Team** tab, which displays the same report layout but restricted to their mapped users only.
### **6. Reporting**
- The **Instant Answers Report** displays:
- User activity across Instant Answers channels
- Number of queries raised
- Count of active users
- Data can be filtered by time range and user attributes.
- Reports can be downloaded as Excel files for offline review or sharing.
- The report is accessed via **Reports → Instant Answers Report**.
[https://converse.bsharpcorp.com/celebrate/instant\_answers\_report/-1](https://converse.bsharpcorp.com/celebrate/instant_answers_report/-1)
### **7. Best Practices**
- Apply attribute filters to analyze usage by department or role.
- Use longer time ranges (last quarter or last 12 months) for trend analysis.
- Export reports regularly if historical comparison is required.
- Review both query count and active users together to understand true engagement.
### **8. Related Links / FAQs**
- **Related:** [User Management Dashboard Report](https://help.bsharpcorp.com/books/reports/page/user-management-dashboard-report)
- **Related:** [Learning of the Day Report](https://help.bsharpcorp.com/books/reports/page/learning-of-the-day-report)
**FAQ**
**Who can view the Team tab?**
Only users assigned as managers, trainers, or mentors can view the Team tab.
### **9. Version Notes**
****Last Updated:**** 31 Dec 2025