# Learning Pathway Master Report
### **1. Overview**
The Learning Pathway Master Report provides a consolidated view of pathway performance across the organization. It helps track completion status, compare pathway types (Normal and Mandatory), and analyze learning progress using filters and summary insights.
### **2. When to Use**
- When tracking completion status of all learning pathways
- When monitoring Mandatory vs Normal pathway performance
- When reviewing recent pathway trends based on time period
- When analyzing completion across teams or attributes
### **3. Concepts**
- **Pathway Created Date** – Filters pathways based on when they were created in the system.
- **Custom Date Range** – Allows selecting a specific start and end date for analysis.
- **Pathway Type (Normal / Mandatory)** – Defines whether the pathway is a regular learning pathway or a mandatory one that must be completed within a set timeline.
- **Attribute Filter** – Narrows report data using user attributes like department or location.
- **Company Tab** – Displays pathway completion data for all users in the organization.
- **Team Tab** – Displays pathway completion data only for users mapped to the manager, trainer, or mentor.
- **Last 10 Pathways** – Shows completion status of the most recently published pathways.
- **Average Completion %** – Indicates the overall average completion percentage across pathways.
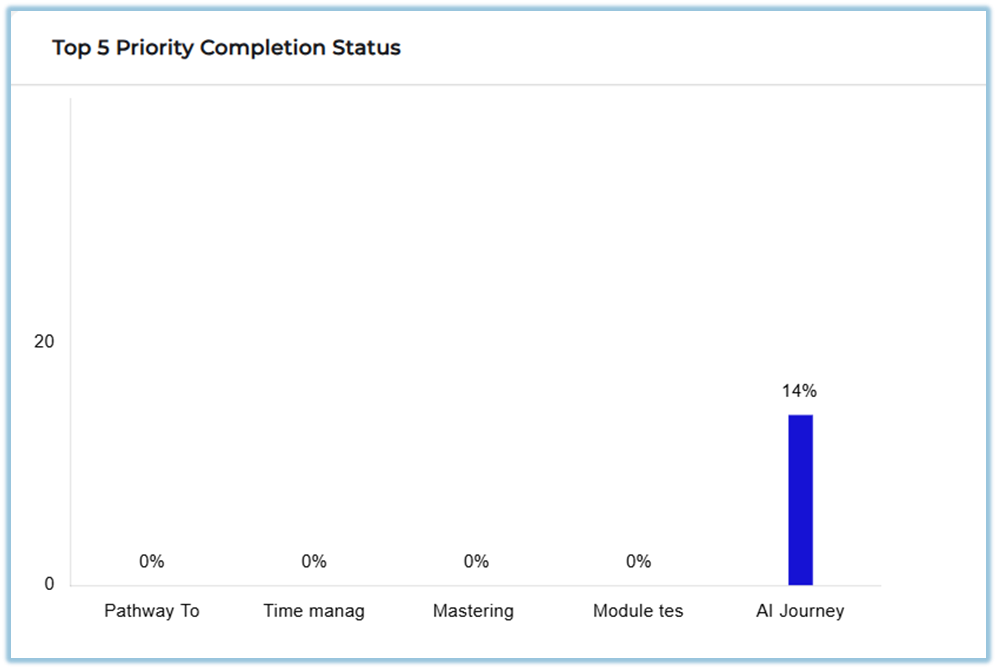
- **Top 5 Priority Pathways** – Highlights completion status of pathways marked as top priorities.
- **Pathway Completion Status** – Shows completion percentage for each pathway.
- **Pathway Drill-down** – Allows navigation to the individual pathway completion report.
- **See All** – Opens a detailed view of all pathway records.
- **Download Report** – Exports pathway completion data for offline review.
### **4. Set Up Guide**
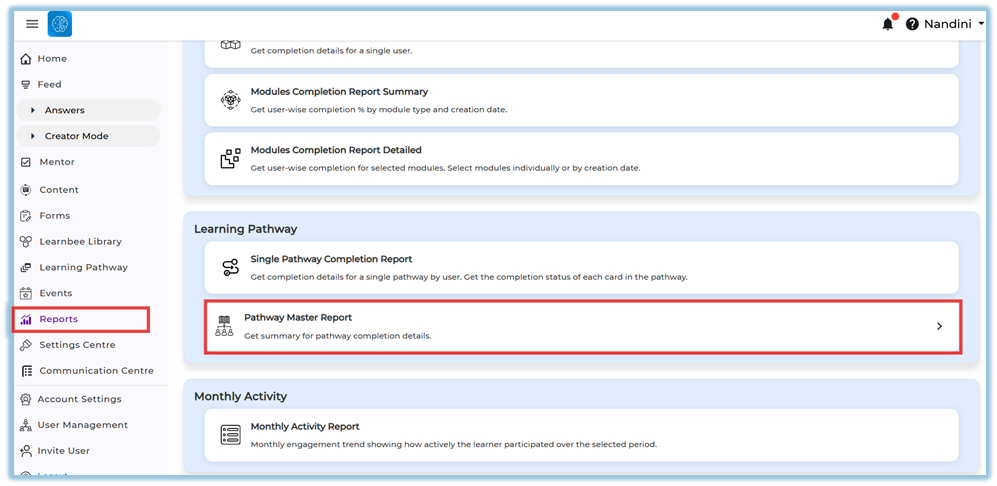
1. **Open Menu** and navigate to **Reports**.
[https://converse.bsharpcorp.com/celebrate/user-report-page](https://converse.bsharpcorp.com/celebrate/user-report-page)
2. Under **Learning Pathway**, select **Learning Pathway Master Report**.
[https://converse.bsharpcorp.com/celebrate/pathway\_master\_report](https://converse.bsharpcorp.com/celebrate/pathway_master_report)
3. Select **Pathway Created Date**
Choose predefined range OR custom date
4. Select **Pathway Type**
- Normal
- Mandatory

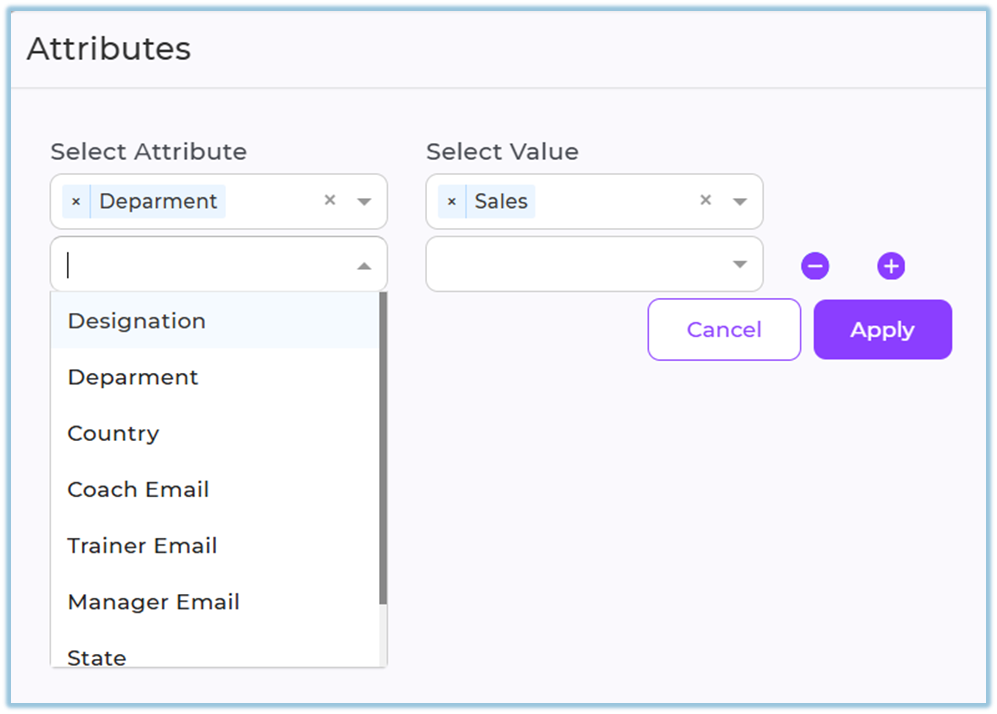
5. Click **Attribute Filter** (optional)
- Select attribute (Department, Role, etc.)
- Select values
- Click Apply
6. Click **Apply** to load the filtered report data.
7. Review the **dashboard summary**, including average completion percentage and recent pathway completion trends.
8. View the **last 10 published pathways** and their completion percentages displayed on the dashboard.
9. Review **priority pathway completion status** shown for the top priority pathways.
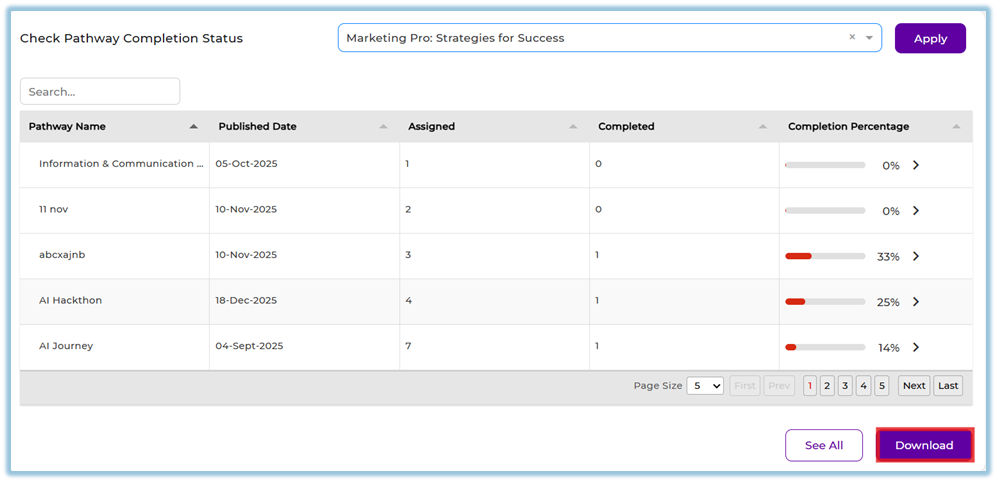
10. In **Check Pathway Completion Status**, select a **Pathway** to view its completion details.
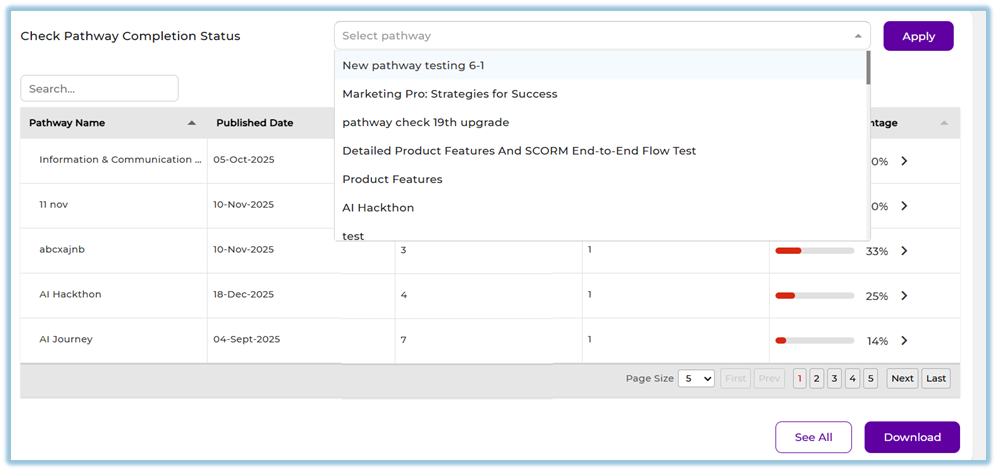
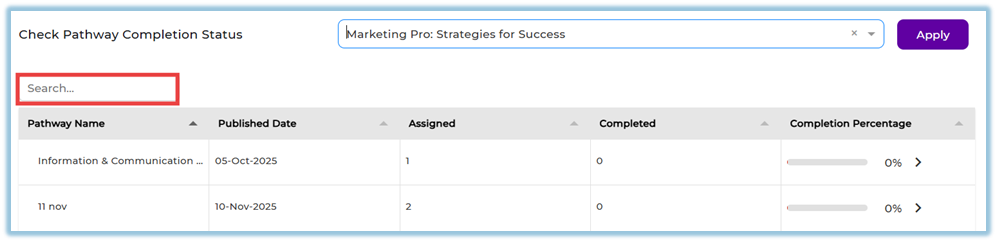
11. Use the **Search** option to find a specific pathway (reset filters before searching if required).
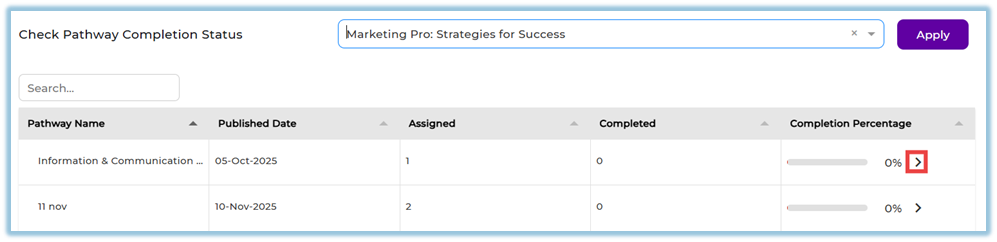
12. Click the **arrow icon** next to a pathway to open the **Single Pathway Completion Report**.
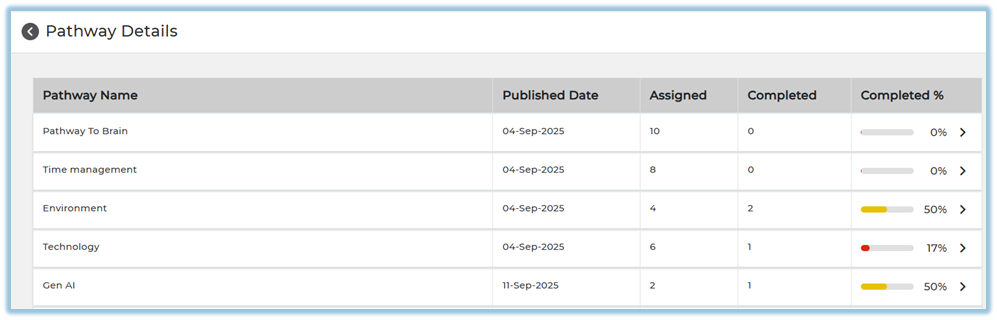
13. Use **See All** to view all pathway details.
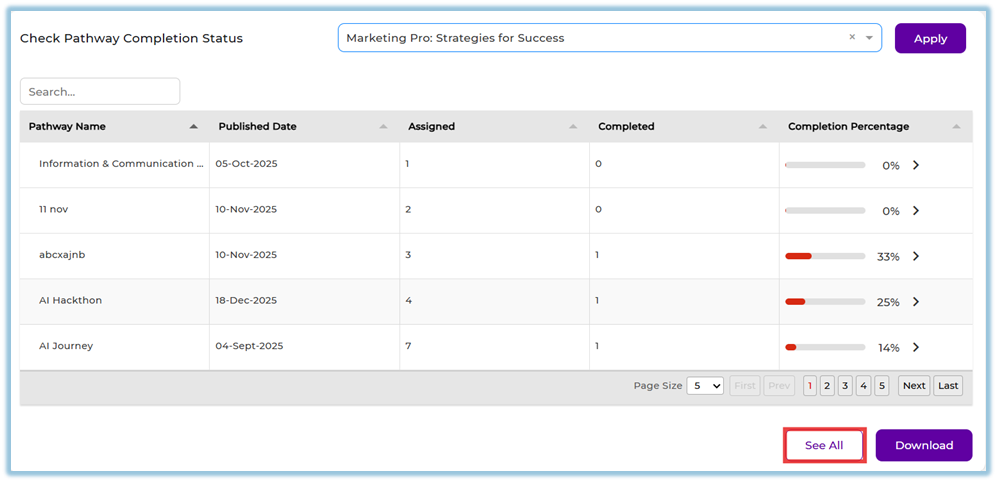
14. Click **Download** to export the report.
### **5. User View**
Admins can view all pathways and completion data in the **Company** tab.
Managers, Trainers, and Mentors can view only their mapped users’ pathway data in the **Team** tab.
Completion charts, percentages, and summaries are visible based on access level.
### **6. Reporting**
- Tracks pathway performance using **Pathway Master Report**
- Supports **Normal & Mandatory Pathway filtering**
- Displays pathway-wise completion percentages
- Shows average completion across all pathways
- Highlights priority pathway performance
- Supports drill-down to individual pathway reports
### **7. Best Practices**
- Use date filters to analyze relevant time periods
- Apply attributes to focus on specific user groups
- Regularly monitor priority pathway completion
- Use drill-down reports for deeper analysis
### **8. Related Links / FAQs**
**Can I see user-level completion here?**
No, this report shows pathway-level summary data.
**Why is some data not visible to me?**
Visibility depends on Company or Team tab access.
### **9. Version Notes**
**Last Updated:** 25 Mar 2026