# Modules Completion Report Summary
### **1. Overview**
The Modules Completion Report Summary provides a consolidated view of how users are progressing across different types of modules within the platform. It helps administrators and team-level users understand overall completion trends, user participation, and average completion performance for published modules within a selected time period.
### **2. When to Use**
- When you want to review overall module completion performance across users.
- When you need a summarized view of completion percentages by module type.
- When managers, trainers, or mentors want to track completion status for their mapped users.
- When preparing completion reports for internal reviews or audits.
### **3. Concepts**
- **Module Type** – The category of learning content such as Learning Module, Video, PDF, or Learnbee.
- **Published Date Range** – The time period during which the selected modules were published.
- **Attribute Filters** – User-based filters such as designation, department, country, manager, trainer, or location.
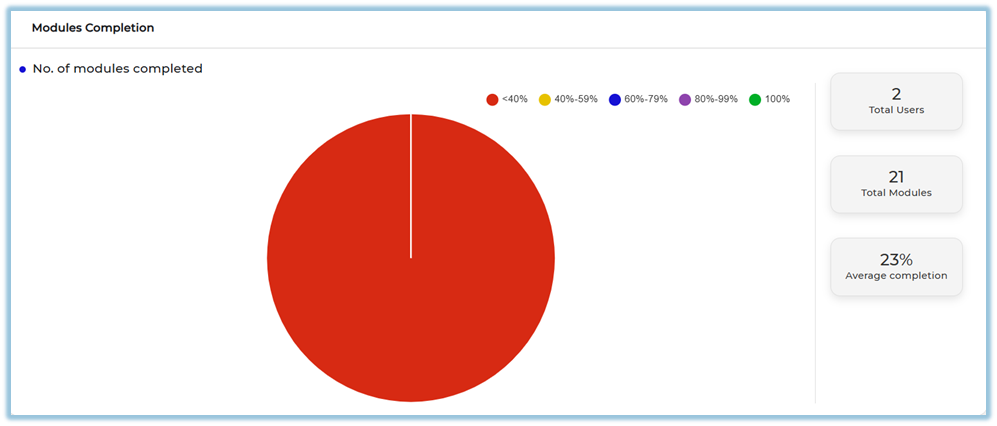
- **Completion Distribution** – A visual breakdown of users grouped by completion percentage ranges.
- **Summary Metrics** – High-level statistics including total users, total modules, and average completion percentage.
- **User Completion Status** – User-level details showing assignment, completion count, and completion percentage.
- **Company View** – Organization-wide completion data visible to administrators.
- **Team View** – Completion data limited to users mapped to a manager, trainer, or mentor.
- **Report Download** – Exportable report data with configurable columns.
### **4. Set Up Guide**
1. Open the **Menu Bar** and click on **Reports**.
[https://converse.bsharpcorp.com/celebrate/user-report-page](https://converse.bsharpcorp.com/celebrate/user-report-page)
2. Under the **Content** section, click on **Modules Completion Report Summary**.
[https://converse.bsharpcorp.com/celebrate/user\_completion\_report](https://converse.bsharpcorp.com/celebrate/user_completion_report)
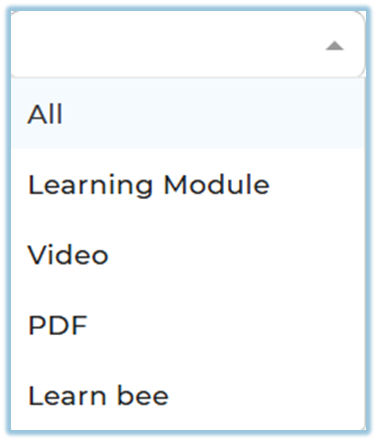
3. Select a value from **Select Module Type** (All, Learning Module, Video, PDF, Learnbee).
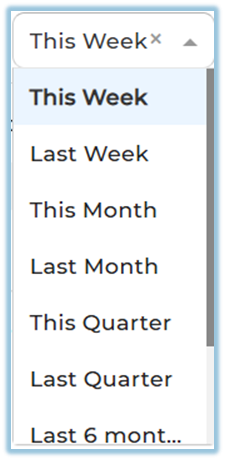
4. Choose a value from **Modules Published Date** (This Week, Last Week, This Month, Last Month, This Quarter, Last Quarter, Last 6 Months, Last 12 Months, or Custom).
5. Click **Apply** to load the report based on the selected filters.

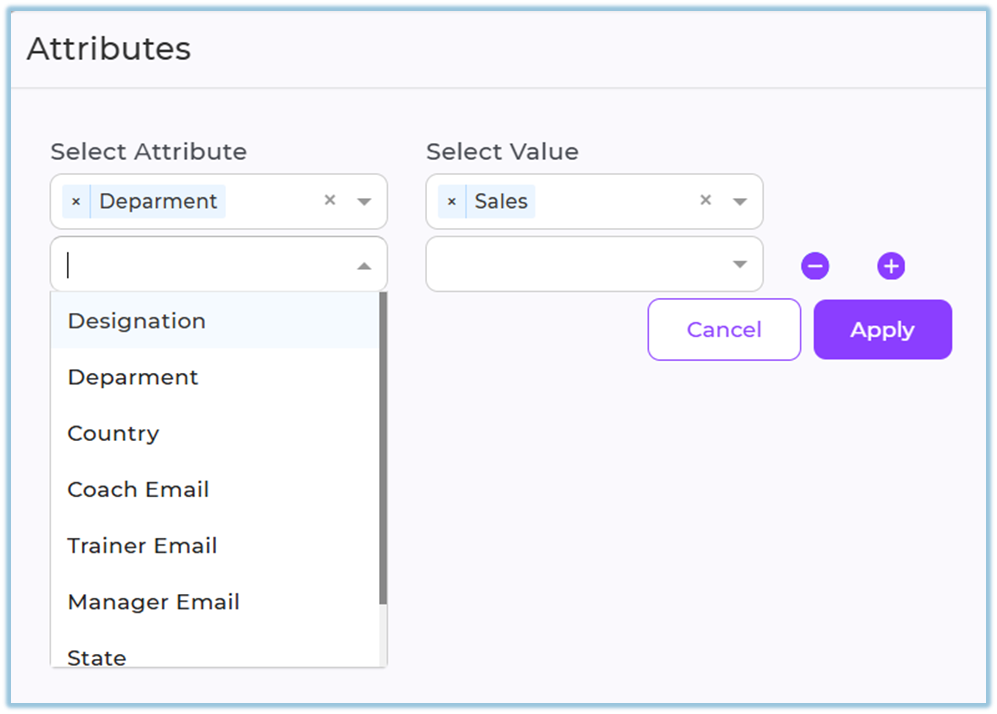
6. (Optional) Click **Attribute filter** to filter data by designation, department, country, coach email, trainer email, manager email, state, or city.
7. Select the required attribute values and click **Apply** to update the report.
8. Scroll down to view the **Modules Completion** summary and charts.
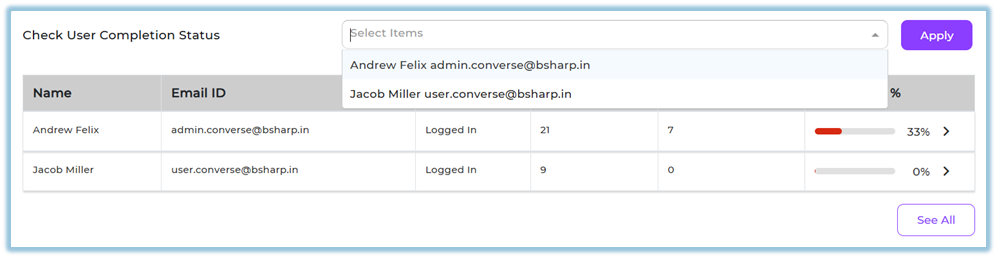
9. Use **Check User Completion Status** to view completion details for specific users.
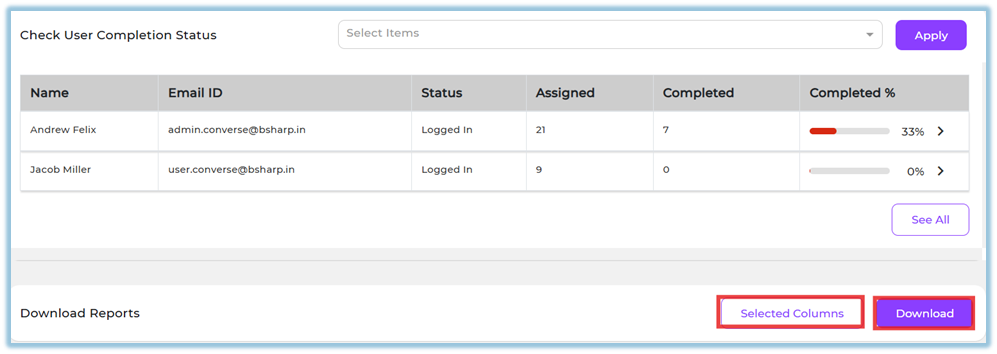
10. Click **Selected Columns** to customize the columns included in the report.
11. Click **Download** to export the report.
### **5. User View**
- Users with **admin access** can view the **Company** tab showing completion data for all users.
- Users assigned as **manager, trainer, or mentor** can view the **Team** tab showing data only for their mapped users.
- The dashboard displays completion distribution, summary metrics, and user-level completion details.
- Users can visually interpret completion status using pie charts and percentage indicators.
### **6. Reporting**
- **Modules Completion Report Summary**
- Displays total users, total modules, and average completion percentage.
- Shows completion distribution grouped by percentage ranges.
- Provides user-level completion status with assignment and completion details.
- Accessible from **Reports → Content → Modules Completion Report Summary**.
[https://converse.bsharpcorp.com/celebrate/user\_completion\_report](https://converse.bsharpcorp.com/celebrate/user_completion_report)
- Supports report export with customizable columns.
### **7. Best Practices**
- Apply date and module type filters before reviewing completion trends.
- Use attribute filters to analyze performance for specific teams or regions.
- Review user-level completion data to identify users needing follow-up.
- Customize report columns before downloading to keep reports concise.
### **8. Related Links / FAQs**
**Q: Who can access the Team tab?**
A: Only users mapped as managers, trainers, or mentors can access the Team tab.
**Q: Can I download the report for selected users only?**
A: Yes, by applying user and attribute filters before downloading.
### **9. Version Notes**
**Last Updated:** 5 Jan 2026