# Monthly Activity Report
### **1. Overview**
The Monthly Activity Report provides a consolidated view of user engagement across the platform. It displays activity trends, feature usage, completion metrics, inactive users, publishing trends, and leaderboards using visual dashboards and summary cards.
### **2. When to Use**
- When you want to review overall engagement across the organization.
- When analyzing feature usage trends such as Instant Answers, Daily Learning, and Content.
- When tracking module and pathway completion trends.
- When identifying inactive users or reviewing monthly leaderboard performance.
### **3. Concepts**
- **Company Tab** – Displays activity data for the entire organization.
- **Team Tab** – Displays activity data limited to users mapped to the viewer.
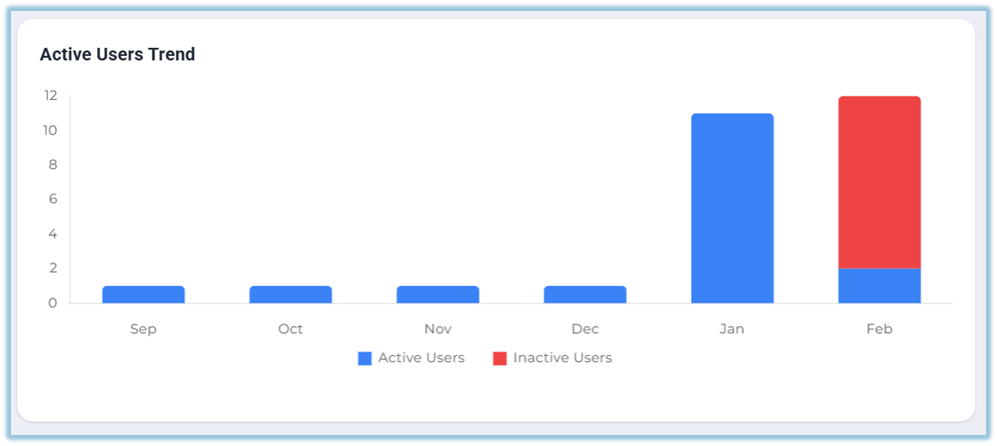
- **Active Users Trend** – Shows monthly active and inactive user comparison.
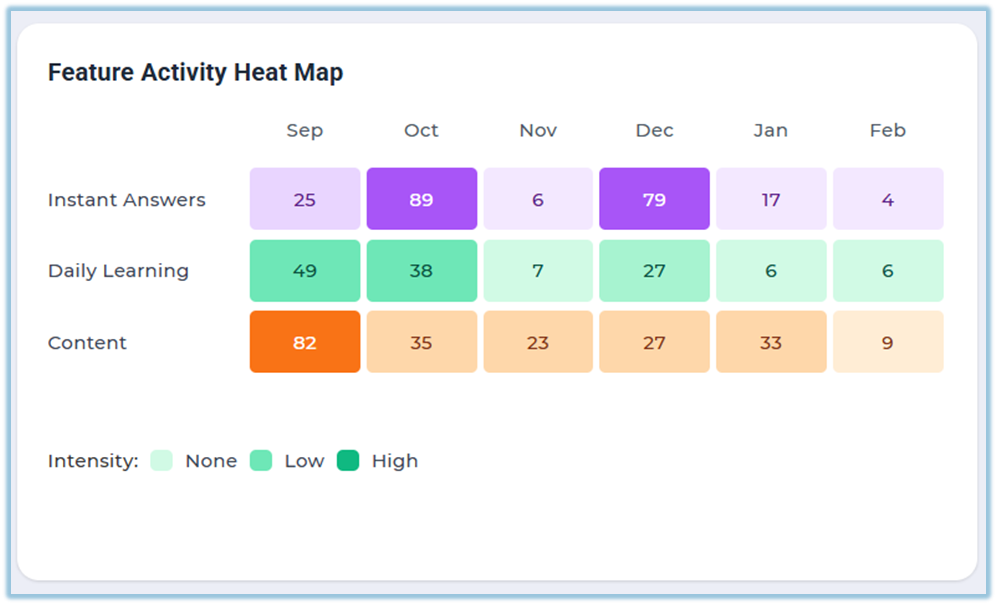
- **Feature Activity Heat Map** – Displays usage intensity across features.
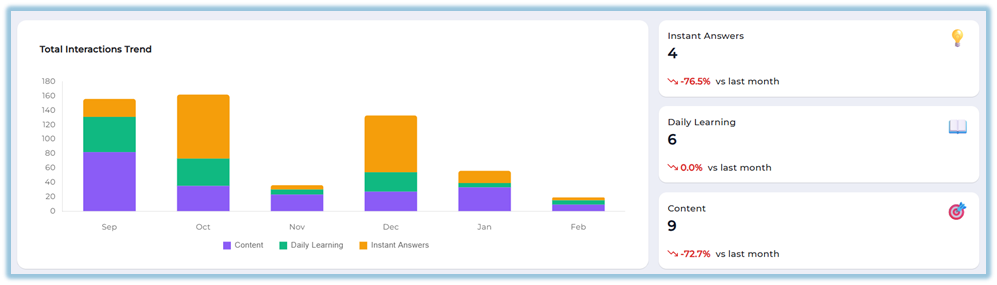
- **Total Interactions Trend** – Shows total completed interactions across features.
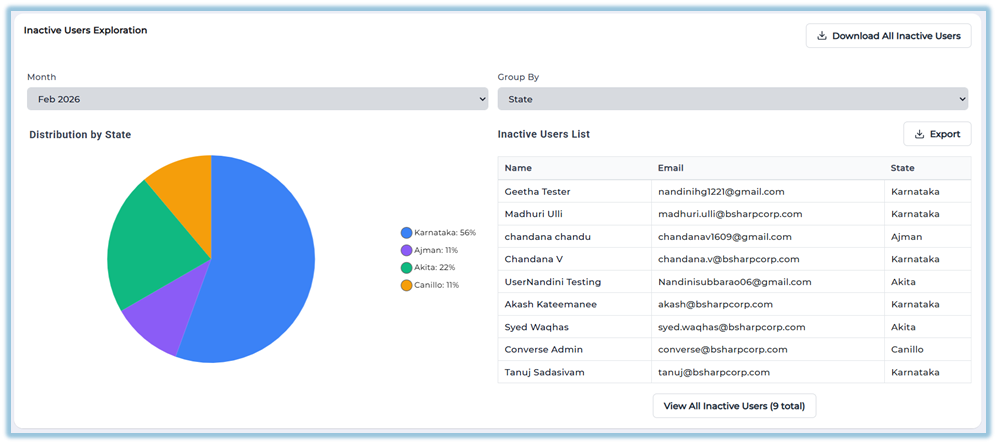
- **Inactive Users Exploration** – Displays inactive user distribution and detailed list.
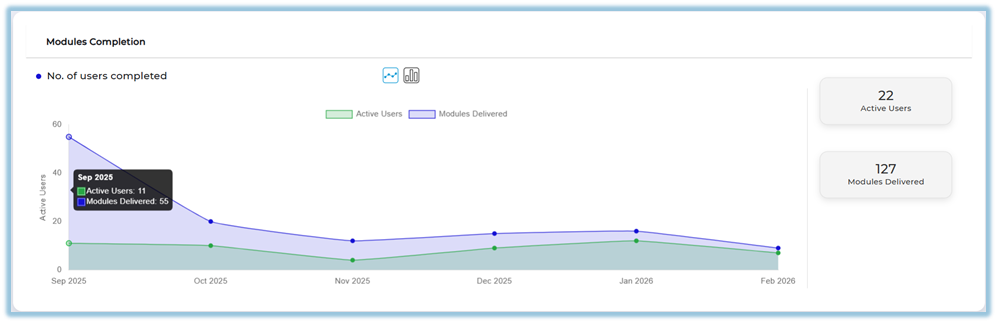
- **Modules Completion** – Shows number of users completed and modules delivered.
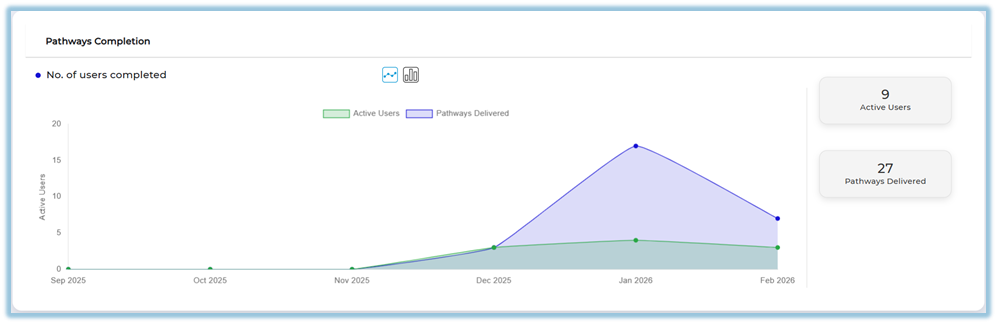
- **Pathways Completion** – Displays pathway delivery and completion trends.
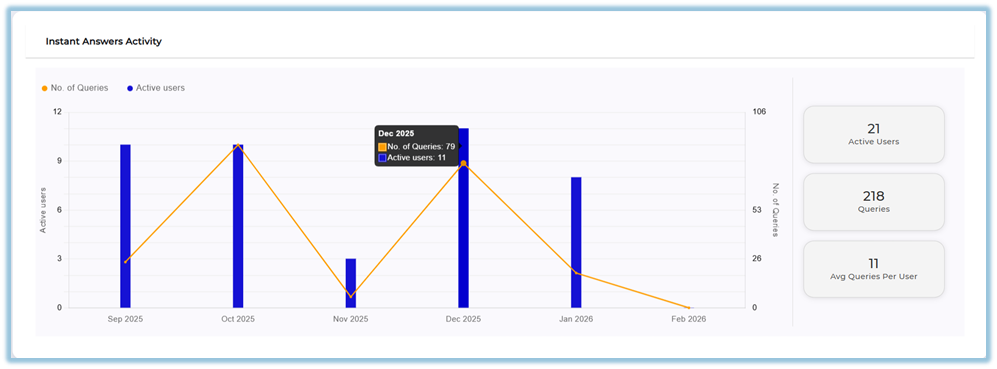
- **Instant Answers Activity** – Shows query count and active users.
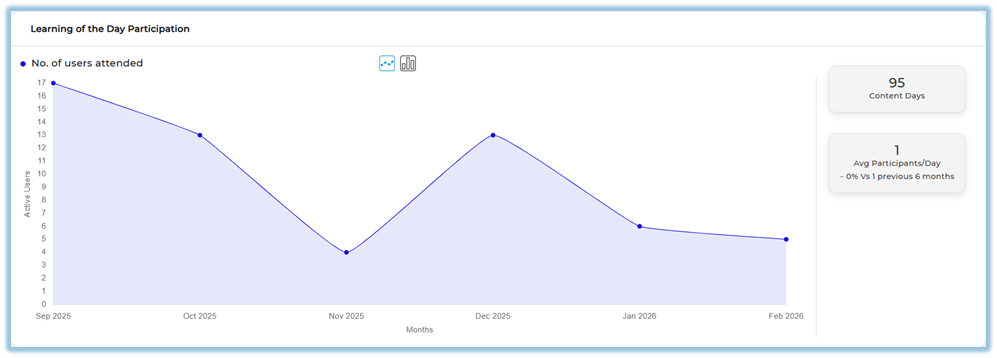
- **Learning of the Day Participation** – Displays participation trends.
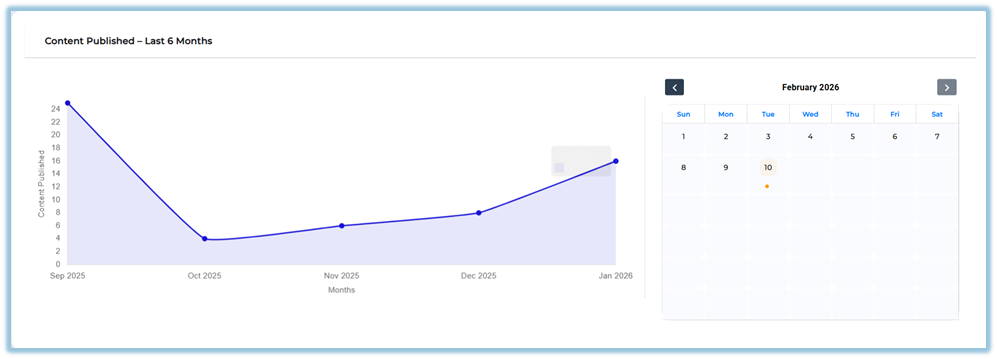
- **Content Published – Last 6 Months** – Shows content publishing trends and calendar view.
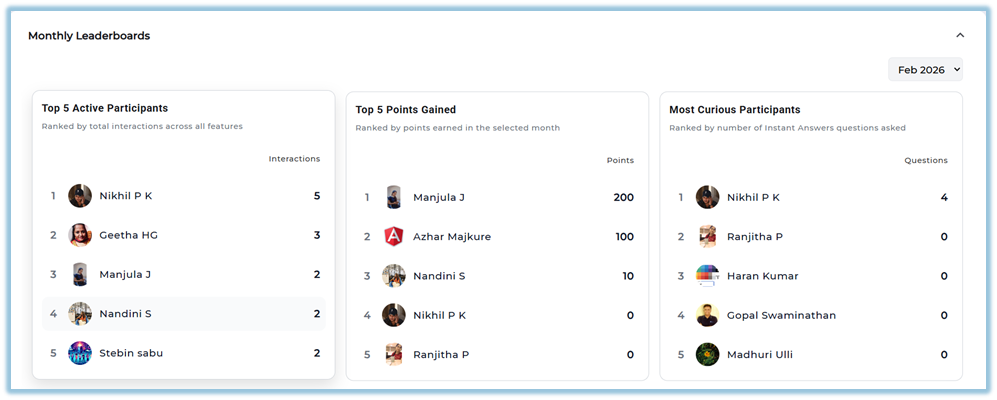
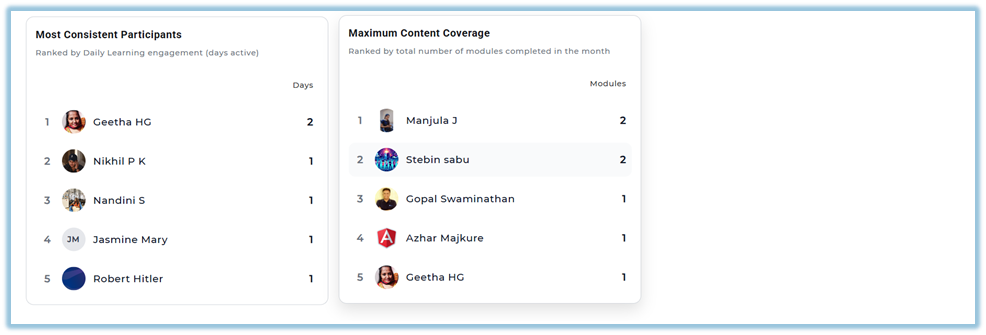
- **Monthly Leaderboards** – Displays top participants based on different metrics.
### **4. Set Up Guide**
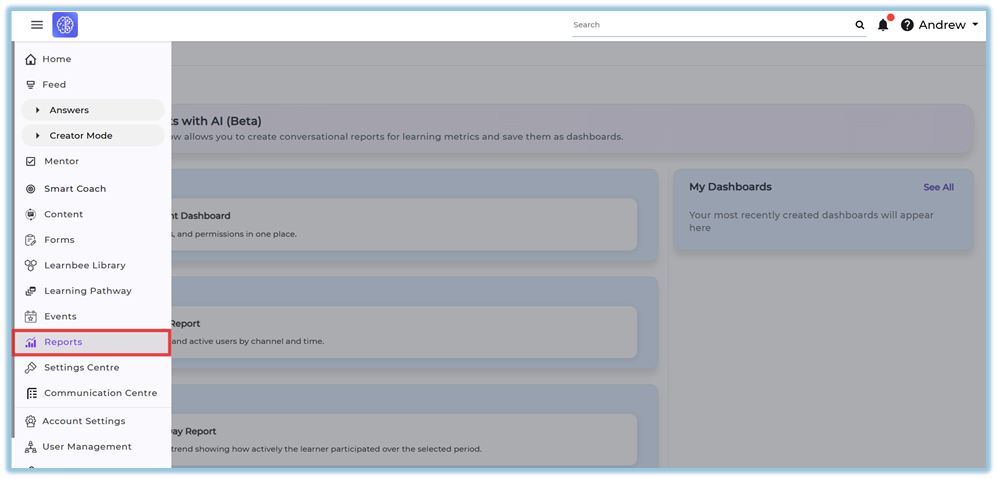
1. Click the three-line **Menu** from the homepage.
2. Click **Reports**.
3. Select **Monthly Activity Report**.
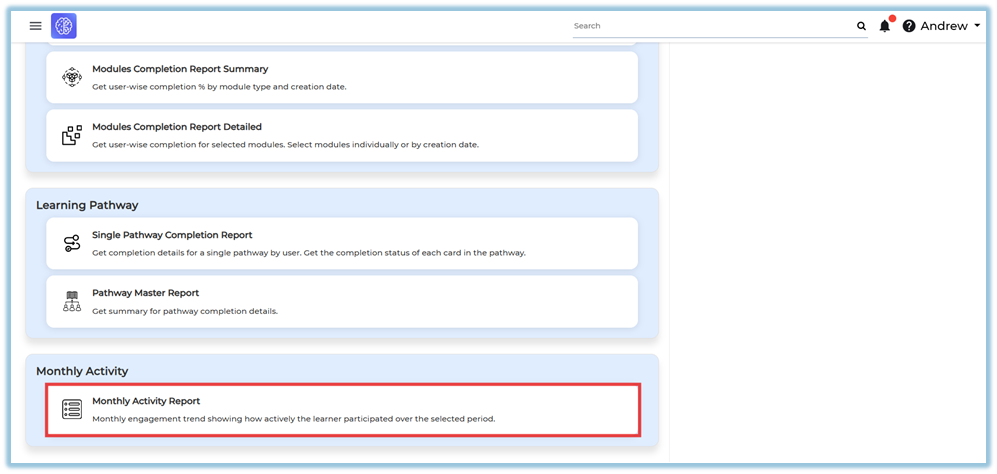
4. The report opens with two tabs: **Company** and **Team**.
5. Select the appropriate tab based on your access level.
6. Review the **Active Users Trend** section to see monthly active and inactive users.
7. Review the **Feature Activity Heat Map** to analyze usage intensity for:
- Instant Answers
- Daily Learning
- Content
8. Scroll to **Total Interactions Trend** to view interaction breakdown across features.
9. Review the summary cards for:
- Instant Answers
- Daily Learning
- Content
10. Scroll to **Inactive Users Exploration** to:
- Select the month
- Choose grouping criteria (e.g., State)
- View distribution chart
- View inactive users list
- Use **Download All Inactive Users** if required.
11. Review **Modules Completion** to compare Active Users and Modules Delivered.
12. Review **Pathways Completion** to track pathway activity trends.
13. Review **Instant Answers Activity** to analyze queries and active users.
14. Review **Learning of the Day Participation** for participation trends.
15. Review **Content Published – Last 6 Months** and use the calendar view to identify publishing dates.
16. Scroll to **Monthly Leaderboards** to view:
- Top 5 Active Participants
- Top 5 Points Gained
- Most Curious Participants
- Most Consistent Participants
- Maximum Content Coverage
### **5. User View**
- **Admins** can access the report under the **Company tab**, showing complete organizational data.
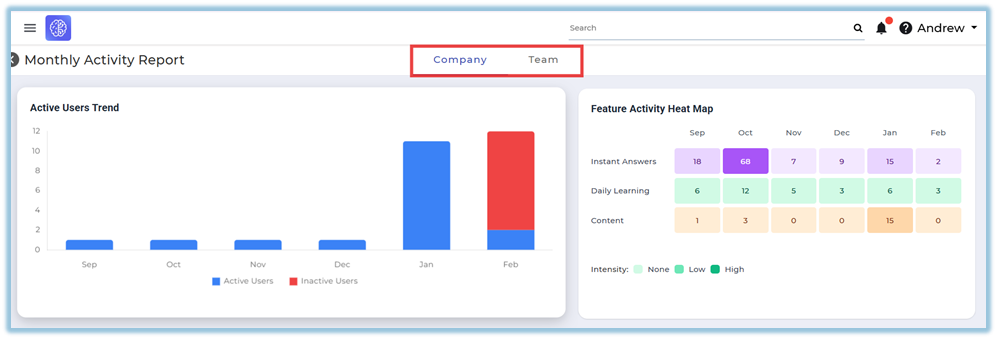
- **Managers, Trainers, and Coaches** can access the report under the **Team tab**, showing only users mapped to them.
- The report is presented entirely through visual dashboards including:
- Bar charts
- Line graphs
- Heat maps
- Summary metric cards
- Pie charts
- Calendar indicators
- Leaderboard tables
### **6. Reporting**
The Monthly Activity Report provides visual dashboards summarizing engagement trends.
- **Active Users Trend** – Displays monthly comparison of active and inactive users.
- **Feature Activity Heat Map** – Shows feature usage intensity across Instant Answers, Daily Learning, and Content.
- **Total Interactions Trend** – Displays total completed interactions across features by month.
- **Inactive Users Exploration** – Shows inactive user distribution and a detailed inactive users list.
- **Modules Completion** – Displays active users and modules delivered over time.
- **Pathways Completion** – Shows active users and pathways delivered trends.
- **Instant Answers Activity** – Displays number of queries and active users.
- **Learning of the Day Participation** – Shows user participation trends over time.
- **Content Published – Last 6 Months** – Displays publishing trends with a calendar view.
- **Monthly Leaderboards** – Displays top participants based on interactions, points, curiosity, consistency, and content coverage.
The report can be accessed from:
**Menu → Reports → Monthly Activity Report** [https://converse.bsharpcorp.com/celebrate/monthly\_activity\_report](https://converse.bsharpcorp.com/celebrate/monthly_activity_report)
Full report download is not available. Export options may be available within specific sections.
### **7. Best Practices**
- Review multiple sections together for better insight correlation.
- Monitor inactive users regularly for follow-up actions.
- Use leaderboard data for performance recognition.
- Validate content publishing using the calendar indicators.
- Compare feature usage patterns across months.
### **8. Related Links / FAQs**
**Q: What does the orange dot in the calendar indicate?**
A: The orange dot indicates that content was created on that specific date.
**Q: What is the difference between Company and Team tabs?**
A: The Company tab shows organization-wide data. The Team tab shows data limited to users mapped to the viewer.
### **9. Version Notes**
Last Updated: 11 Feb 2026