# Single Pathway Completion Report
### **1. Overview**
The Single Pathway Completion Report provides completion details for one selected learning pathway, showing user-wise progress and completion status for each card within the pathway.
### **2. When to Use**
- When you need to review completion status for a specific learning pathway.
- When tracking how users are progressing across cards within a single pathway.
- When managers, trainers, or coaches need visibility into pathway completion for their mapped users.
- When validating overall completion percentages for a single pathway.
### **3. Concepts**
- **Single Pathway** – One learning pathway selected at a time.
- **Company Tab** – Shows data for all users (Admin only).
- **Team Tab** – Shows data for mapped users (Manager/Trainer/Coach).
- **Attribute Filter** – Filters users by attributes.
- **Completion Chart** – Shows completed vs not completed users.
- **Completion Summary** – Displays total users and completion percentage.
- **User Completion Table** – Shows user-level completion details.
- **User Drill-down** – Opens individual user journey details.
- **Selected Columns** – Controls fields in the downloaded report.
- **Download Report** – Exports pathway completion data.
### **4. Set Up Guide**
1. Open the **menu bar** and navigate to **Reports**.
[https://converse.bsharpcorp.com/celebrate/user-report-page](https://converse.bsharpcorp.com/celebrate/user-report-page)
2. Go to the **Learning Pathway** section under Reports.
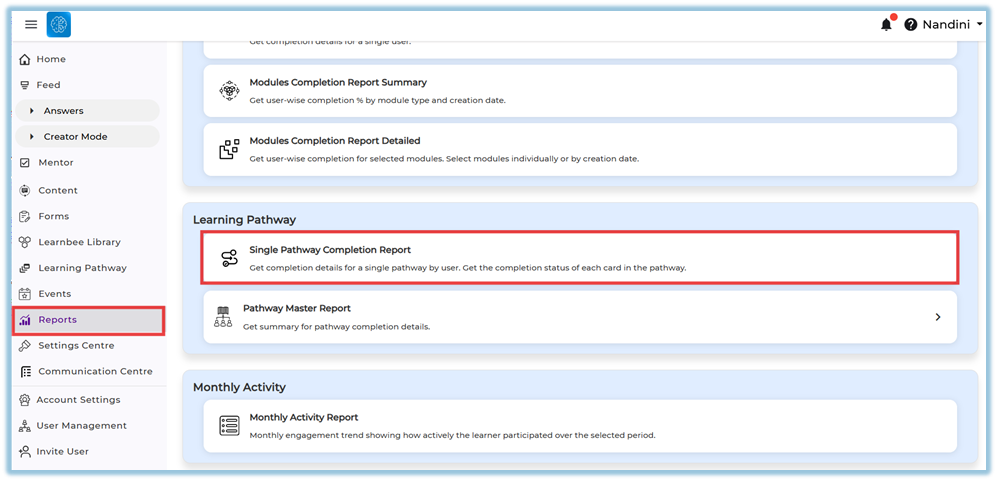
3. Select **Single Pathway Completion Report**.
[https://converse.bsharpcorp.com/celebrate/pathway\_individual\_report/0](https://converse.bsharpcorp.com/celebrate/pathway_individual_report/0)
4. Choose **one pathway** from the pathway selection dropdown.
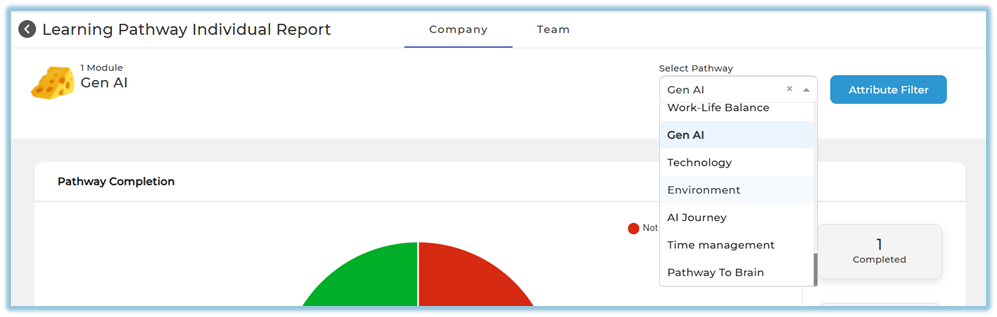
5. Review the pathway details shown on the left side, including the pathway name and number of cards.

6. Click **Attribute filter** to apply attribute-based filtering if required.
7. Select an attribute and value, then click **Apply**.
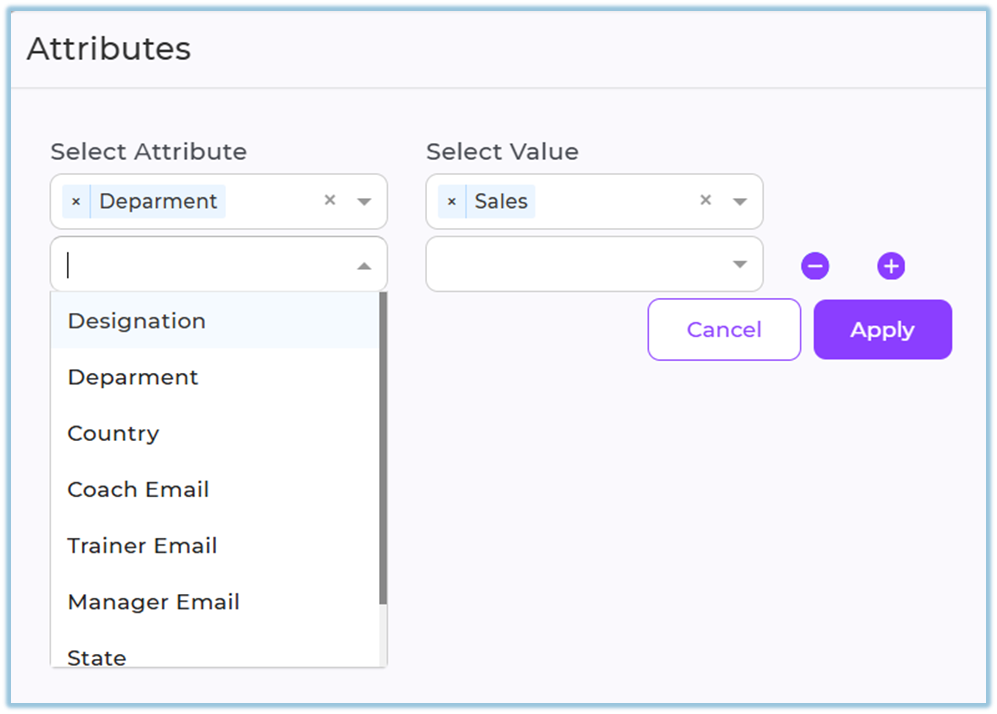
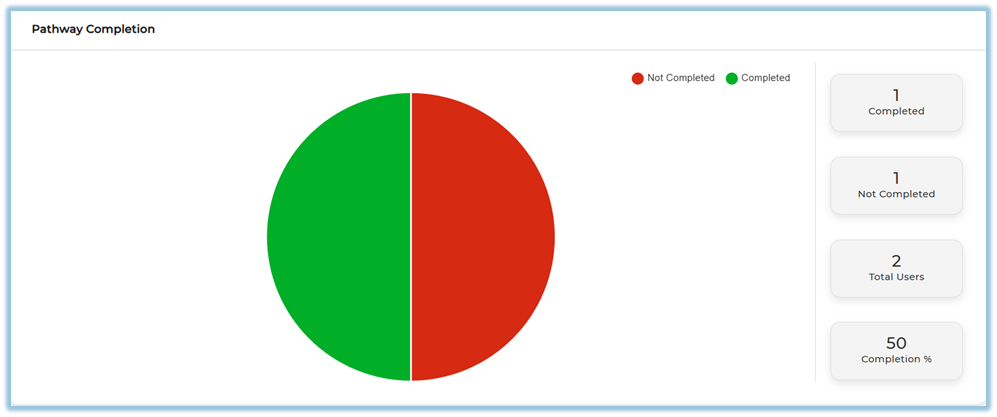
8. Review the updated completion data and charts based on the applied filters.
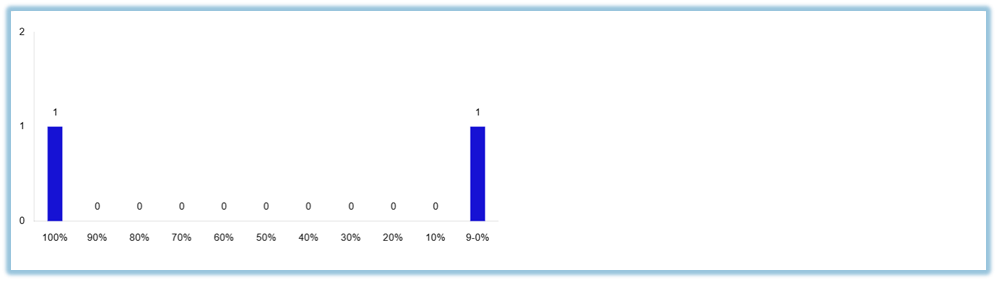
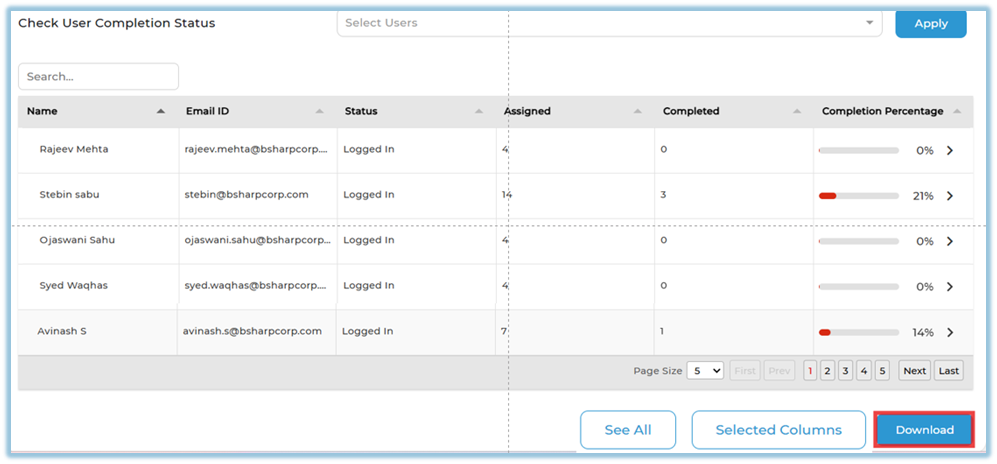
9. Use **Check User Completion Status** to select users by name or search.
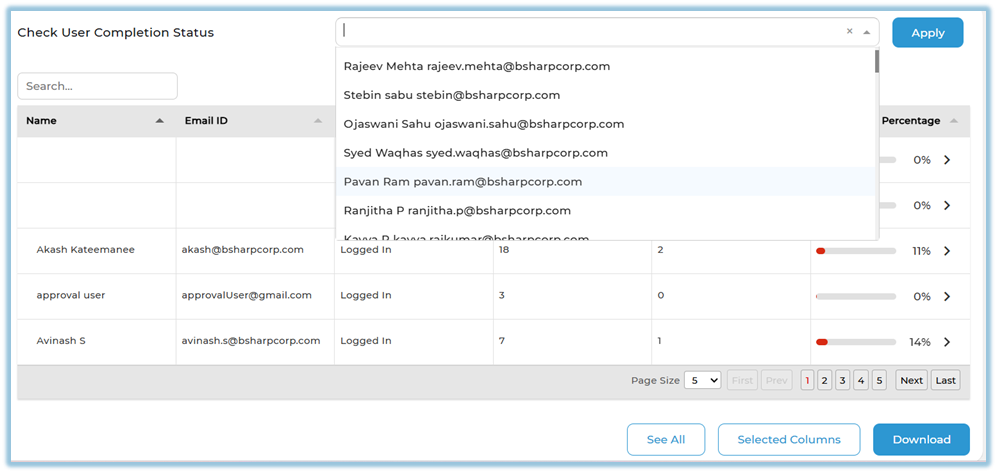
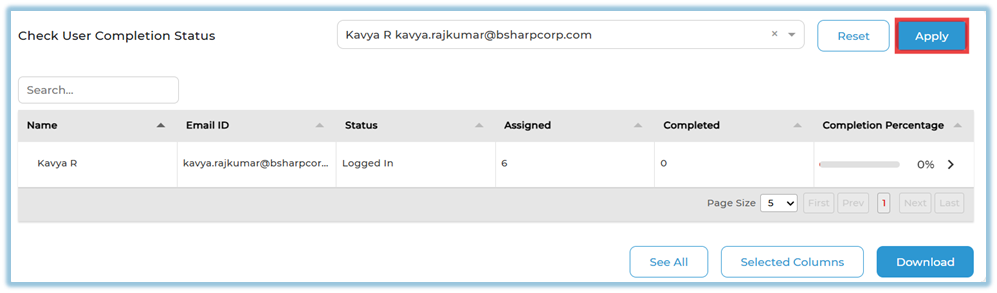
10. Click **Apply** to view user-level completion details.
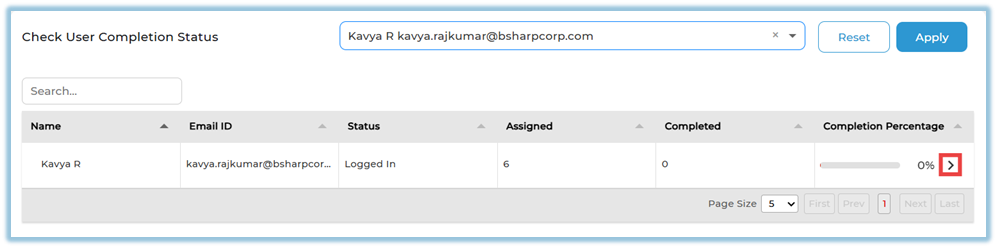
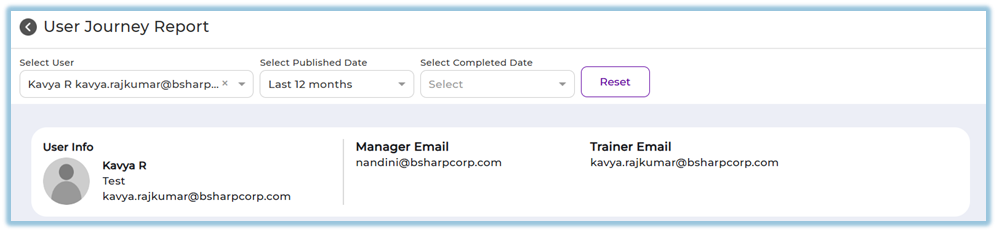
11. Click the arrow icon against a user to navigate to the **User Journey Report**.
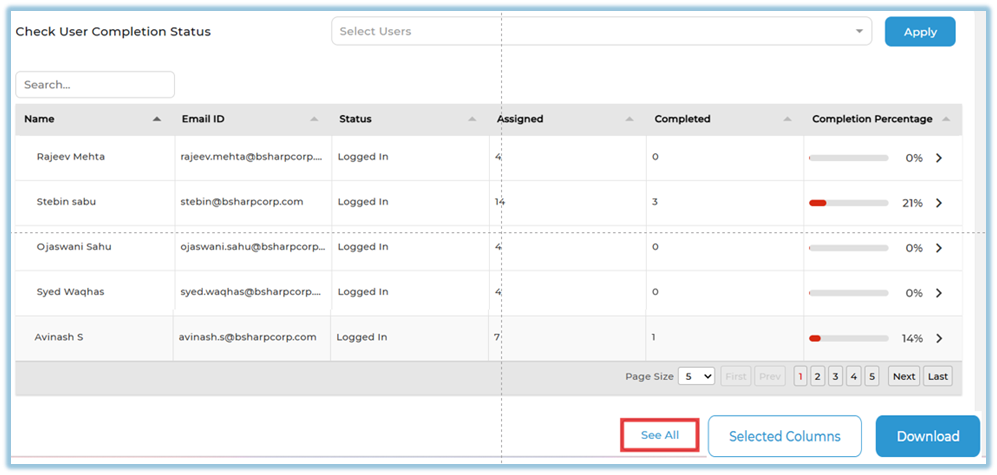
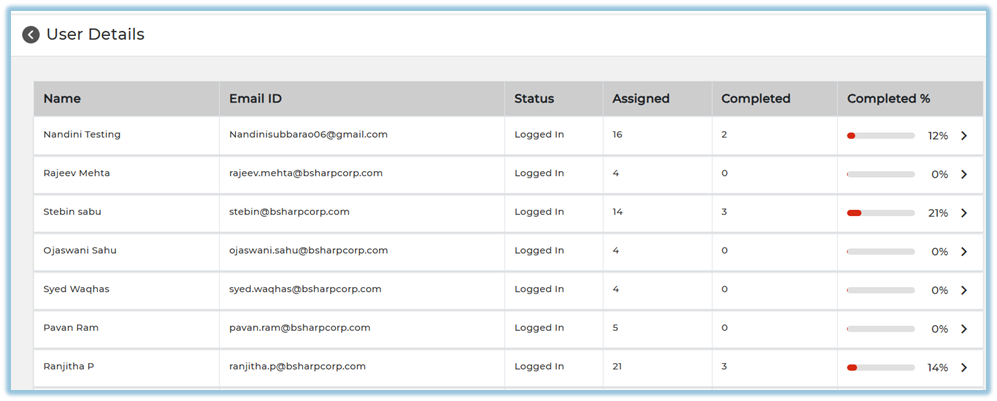
12. Click **See All** to view completion details for all users.
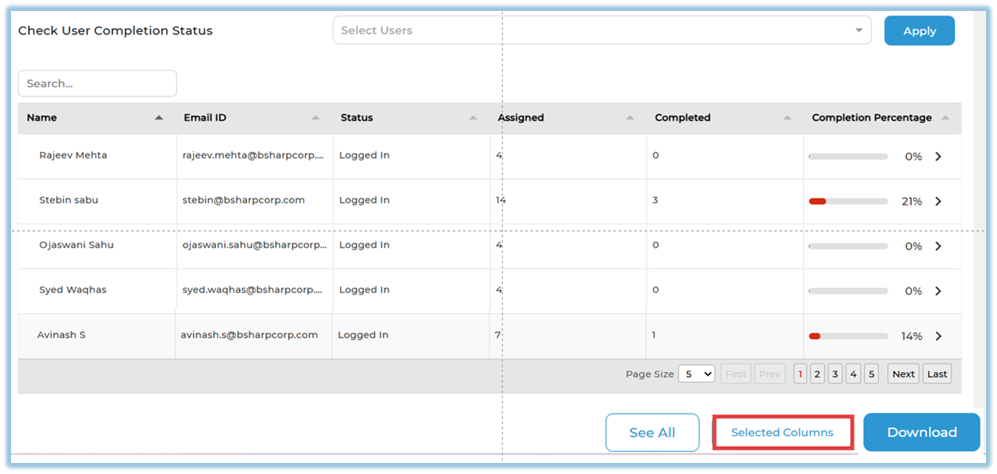
13. Click **Selected Columns** to customize report columns.
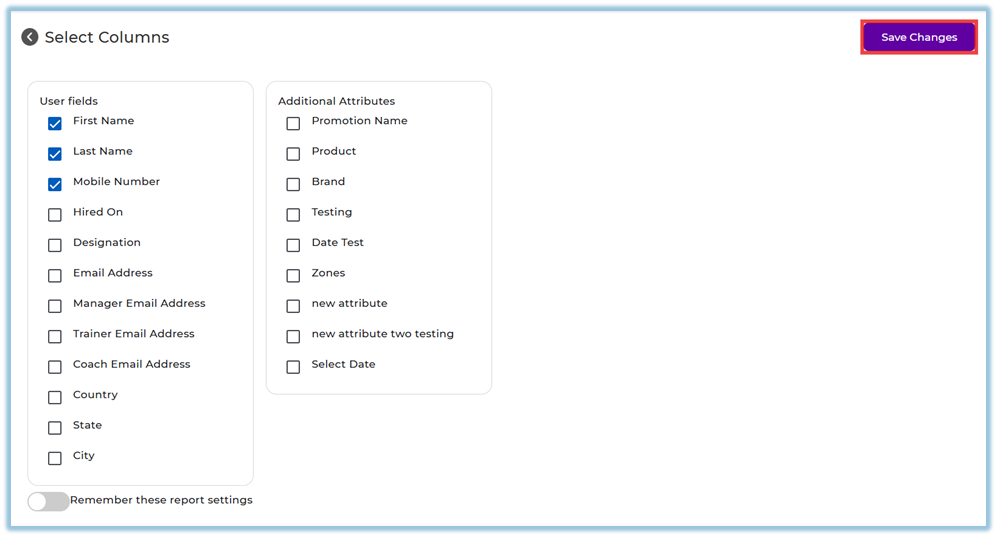
14. Click **Save changes** and then **Download** to export the report.
### **5. User View**
- Admins see the **Company** tab.
- Managers, Trainers, and Coaches see the **Team** tab.
- Completion charts and user tables are visible based on access.
### **6. Reporting**
- **Single Pathway Completion Report**
- Shows completion status for a selected pathway at user level.
- Displays completed and not completed users using a pie chart.
- Provides total users, completed users, not completed users, and overall completion percentage.
- Allows redirection to **User Journey Report** for detailed user activity.
- Accessible from **Reports → Learning Pathway → Single Pathway Completion Report**.
### **7. Best Practices**
- Select only one pathway, as this report supports single-pathway analysis.
- Apply attribute filters to narrow results to relevant user groups.
- Use user-level completion view for follow-ups and coaching.
- Customize columns before downloading to avoid unnecessary data.
### **8. Related Links / FAQs**
- **What happens when I click the arrow icon next to a user?**
It redirects to the User Journey Report for that user.
- **Why can I select only one pathway?**
This report is designed for individual pathway analysis.
### **9. Version Notes**
Last Updated: 6 Jan 2026