
User Management Dashboard Report
1. Overview
The User Management Dashboard Report helps track user onboarding and login progress across the organization. It provides visibility into registered users, login activity, and pending invitations, with separate views for admins and team owners, enabling
effective monitoring and follow-up actions.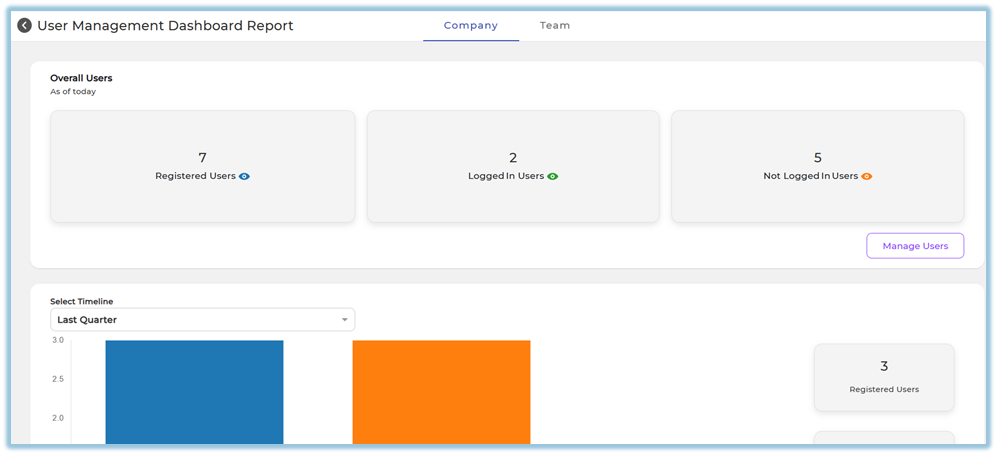
2. When to Use
Use the User Management Dashboard Report when you want to:
-
Monitor overall user adoption of the platform
-
Identify users who are invited but have not logged in
-
Track login trends over a selected time period
-
Review team-wise or role-wise login performance
-
Enable managers, trainers, and mentors to monitor their mapped users
-
Take follow-up actions for inactive or non-logged-in users
3. Concepts
-
Registered Users
Users whose accounts are created and are not blocked. -
Logged In Users
Users who have logged into the platform at least once. -
Not Logged In Users
Users whose accounts are created but have never logged in. -
Total InvitedTotal number of users invited (accounts created) during the selected period. AcceptedUsers who accepted the invite and logged in.Not AcceptedUsers who were invited but have not logged in.Company Tab
Admin-level view showing organization-wide data.-
Team Tab
View available for Managers, Trainers, and Mentors to see only their mapped users. -
Invitation Status:
-
Total Invited: Users created in the system
-
Accepted: Users who logged in
-
Not Accepted: Users who have not logged in
-
4. Set Up Guide
The User Management Dashboard Report does Step-by-Step:not Companyrequire Tabmanual (Adminconfiguration.
Its View)visibility and data scope depend on user role and access mapping already defined in User Setup.
Access Logic
-
GoAdminsto-
fromCan view the
leftCompanynavigationtabmenu.by default -
UnderCan view theUserTeamManagementtab only if,clicktheyonareUseralsoManagementassignedDashboard.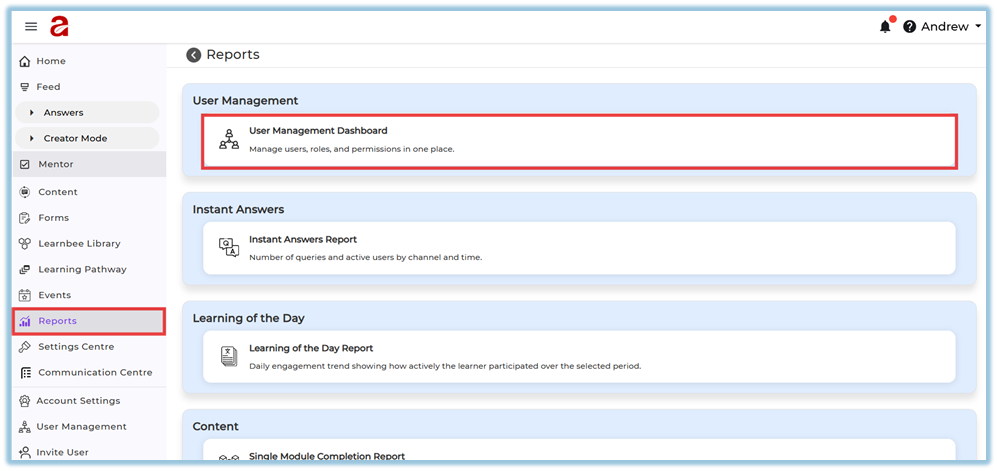
Reports -
-
TheManagersdashboard/opensTrainerswith/two tabs:Mentors-
Can view only the
CompanyTeam tab -
TeamData(visible only if accessshown isenabled)limited to users mapped to them
-
4.1Data OverallMapping Users (As of Today)Source
ThisUser sectioncounts displaysand threemappings keyare metrics:derived from:
-
-
RegisteredUserUsersprofiles -
LoggedAssignedInManagerUsers/ Trainer / Mentor -
NotUserLoggedstatusIn(ActiveUsers
-
Login activity
-
Admins can click Manage Users to directly navigate to the User Management page for further actions.
4.2 Timeline Selection & Graph
Admins can analyze user activity over time using Select Timeline:
This Week / Last WeekThis Month / Last MonthThis Quarter / Last QuarterLast 6 MonthsLast 12 MonthsCustom (From Date – To Date)
The graph visually represents:
Total InvitedNot AcceptedAccepted
Based on the selected timeline, the summary cards update dynamically.
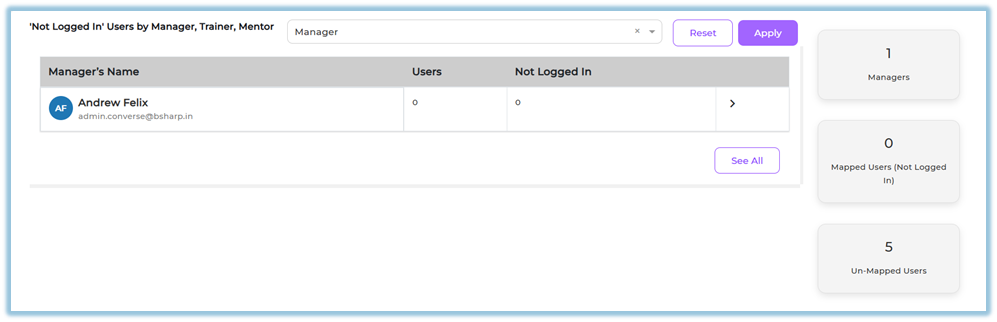
4.3 Not Logged In Users by Manager / Trainer / Mentor
Admins can:
SelectManager, Trainer, or Mentorfrom the dropdownClickApply
This view shows:
Name of the Manager / Trainer / MentorTotal mapped usersCount of users who have not logged inAdmins can also view:Total TrainersMapped Users (Not Logged In)Unmapped Users
This helps identify whether users are properly assigned to managers, trainers, or mentors.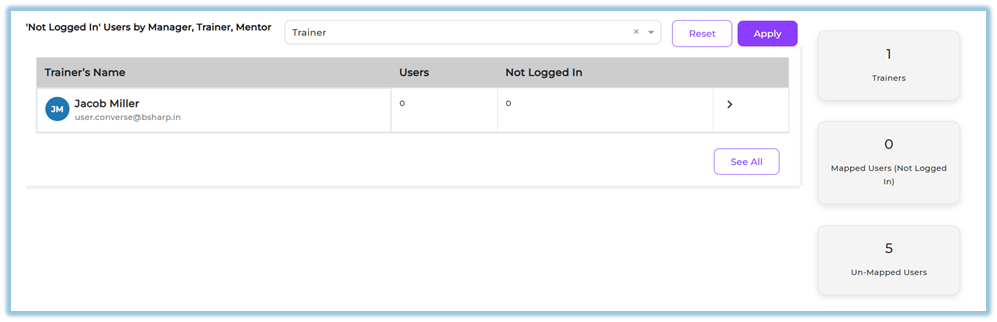
Clicking on an entry or See All redirects to the User Management page with filtered results.
Step-by-Step: Team Tab (Manager / Trainer / Mentor View)
The Team tab is visible only to users who are assigned as:
ManagerTrainerMentor
4.1.1. Overall Users (As of Today)
Team users can see:
Number of users mapped to themLogged in usersNot logged in users
This view is restricted only to their assigned users, not the full organization.
4.1.2. Timeline & Graph
The timeline options and graph behavior remain the same as the Company tab, but: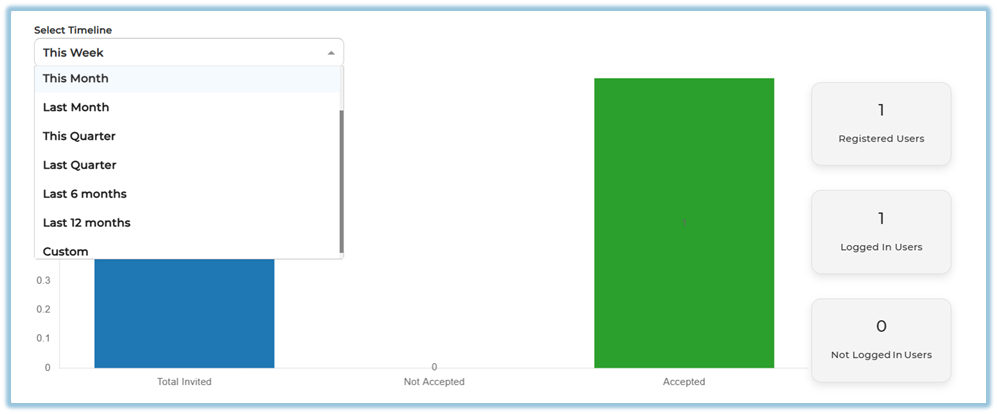
Data is limited to the team user’s mapped users only
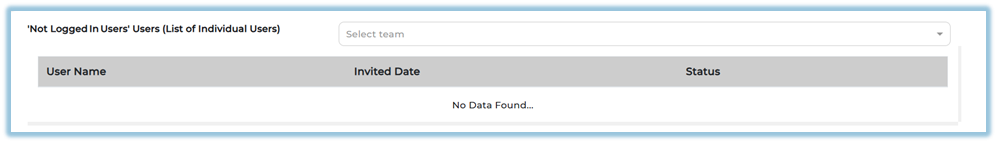
4.1.3. Not Logged In Users – Individual User View
Unlike the Company tab:
Data is shownuser-wise, not manager-wiseDisplays:User NameInvited DateLogin Status
This helps managers, trainers, and mentors take direct follow-ups with specific users.
5. User View
The User Management Dashboard Report is displayed based on the user’s role and access level.
-
Admins
Admins can always view the Company tab. -
The Company tab shows overall user data for the entire organization, including:
-
Registered users
-
Logged-in users
-
Not logged-in users
-
Timeline-based onboarding trends
-
User status breakdown by Manager, Trainer, and Mentor
-
-
If an Admin is also assigned as a Manager, Trainer, or Mentor, then:
-
The Team tab will also be visible to that admin.
-
This allows the admin to view team-specific data in addition to company-wide data.
-
-
Managers / Trainers / Mentors
-
Can access only the Team tab
-
Can see data only for their mapped users
-
Can download reports for their teams
-
6. Reporting
- User Management Dashboard Report supports time-based and mapping-based analysis.
Timeline Analysis
ReportsData can beviewedreviewedbasedacrosson:predefined timelines such as:-
TimelineThis week / Last week -
RoleThismappingmonth / Last month -
This quarter / Last quarter
-
Last 6 months
-
Last 12 months
-
Custom date range
For the selected timeline, the report shows:
-
Total Invited users
-
Accepted users
-
Not Accepted users
-
Corresponding user counts on the dashboard
Not Logged In Users Analysis
Company Tab
-
Displays not-logged-in users grouped by:
-
Manager
-
Trainer
-
Mentor
-
-
Shows:
-
Total mapped users
-
Number of users who have not logged in
-
-
Enables admins to identify ownership gaps and onboarding delays
Team Tab
-
-
Displays individual user lists
-
Shows:
-
User name
-
Invitation date
-
Login status
-
-
AuthorizedHelpsusersmanagers,cantrainers,downloadandthementorsreporttakedatadirectforfollow-upoffline analysis.action ClickingManage Usersredirects to User Management for immediate action.
-
7. Best Practices
-
Regularly monitor Not Logged In Users to improve adoption
-
Ensure users are properly mapped to Managers, Trainers, or Mentors
-
Use Custom timeline for audit or review periods
-
Encourage managers to review the Team tab frequently
-
Follow up early with users who haven’t accepted invites
8. Troubleshooting / FAQs
Q. Why can’t I see the Team tab?
Only users assigned as Manager, Trainer, or Mentor can see it.Q. Why does the graph show zero values?
No users were invited or logged in during the selected timeline.Q. Why can’t I see certain users?
Team users see only users mapped to them.9. Related Links
-
Instant Answers Report
-
Learning of the Day Report
-
Module Completion Reports
-
Learning Pathway Reports
-
Monthly Activity Report
10. Version Notes
Last Updated: 30 Dec 2025
-
The