
User Activity Dashboard
1. Overview
The User JourneyActivity ReportDashboard providesis a consolidatedreport available under the Reports section that allows administrators to view ofengagement an individual user’sand learning progress acrossdetails modulesfor anda single user over the last six months. It consolidates activity, learning pathwaysinteractions, overpoints a selected period. It helps administrators and authorized team roles understand what content has been published to a user, what has been completed, and the current completion status at bothearned, module completion, and pathway levels.progress into one dashboard view.
2. When to Use
-
When you need to review the learning activity of a specific user over the last six months.
-
When you want to
reviewunderstand how actively asingleuseruser’sis engaging with different learningprogress in detail.features. -
When
trackingyoumodule-levelneed to check module andpathway-levelpathway completionfor audits or reviews. When comparing published versus completed learning itemsstatus foraanspecificindividual user.-
When
downloadingyouorwantsharingto download user-specificlevel learningreports.and activity data.
3. Concepts
-
UserReportsSelection:sectionIdentifies–theTheindividualarealearnerinwhoseConverselearningwhereprogressallis being analyzed. Published Date Range:Filters modulesdownloadable andpathwaysviewablebasedreportsonarewhen they were published.Completed Date Range:Filters learning data based on when the user completed modules or pathways.available.-
User
Information:selectionDisplays–basicA dropdown used to choose a single user whose activity data will be displayed. -
User profile details – Basic information shown for the selected user, including contact and role details.
-
Activity overview – A summary of the
selecteduser’s engagement status over the last six months. -
Activity by feature – A breakdown of interactions across learning features such as modules and daily learning.
-
Activity heat map – A visual indicator showing consistency and feature usage intensity over time.
-
Points and rewards – A summary of points earned by the user
forduringreference.the last six months. -
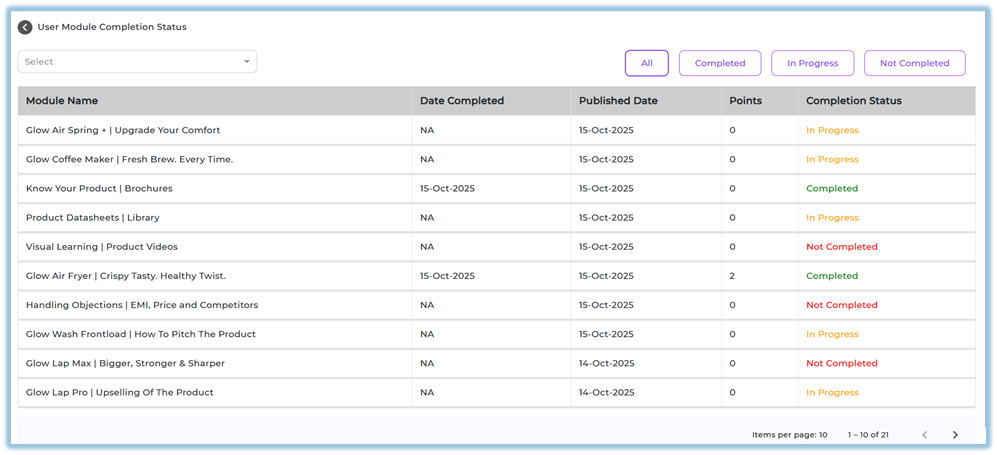
Module
Completion Status:completionShows–theDetailsuser’sof completed, in-progress, and not completedandlearningpublished modules with status indicators. Completion Visualization:Presents module progress using graph and bar chart views.Detailed Module Status:Lists individual modules with their completion status and dates.modules.-
Pathway
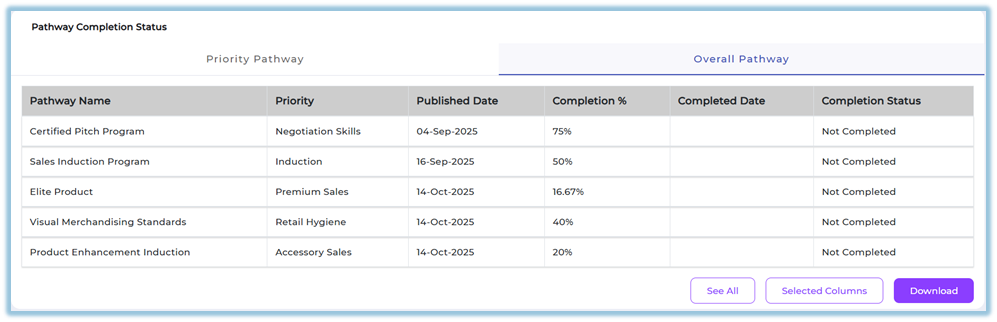
Completion Status:completionShows–theProgressuser’strackingprogress across assigned learning pathways. Priority Pathways:Highlights progress on pathways marked asfor priorityforandtheoveralluser.Overall Pathways:Displays completion details for alllearning pathways assigned to the user.-
Column
Selection:customizationAllows–customizationAnofoption to select which data fieldsincludedappear inthedownloadabledownloaded report.reports. -
ReportDataDownload:downloadEnables–exportingThetheability to export userjourneyactivity databasedforonofflineselected filters and columns.review.
4. Set Up Guide
-
NavigateClicktotheHomethree-line main menu from theleft menu.homepage. -
Click Reports
into open thenavigationreportsmenu.landing page.
https://converse.bsharpcorp.com/celebrate/user-report-page -
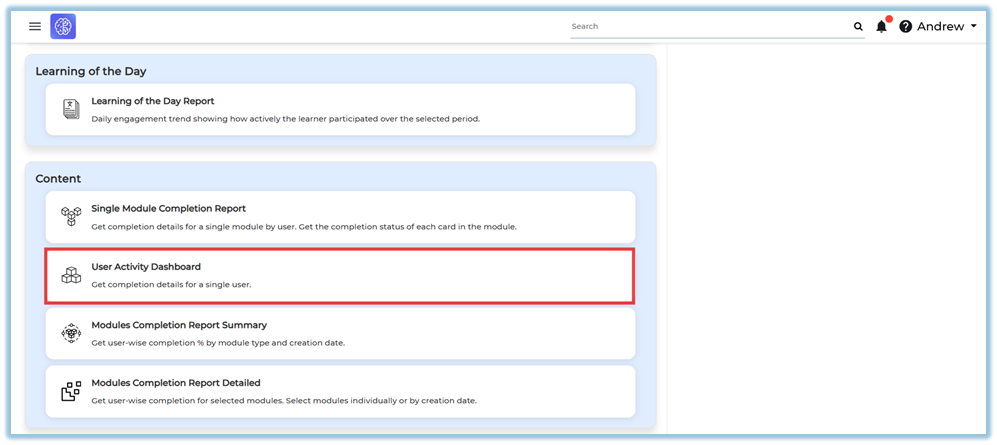
UnderLocate the Contentsection,sectionselectwithinUser Journey Report.Reports.
https://converse.bsharpcorp.com/celebrate/individual_user_reports/269489 In theSelect Userfield, choose the required user from the list.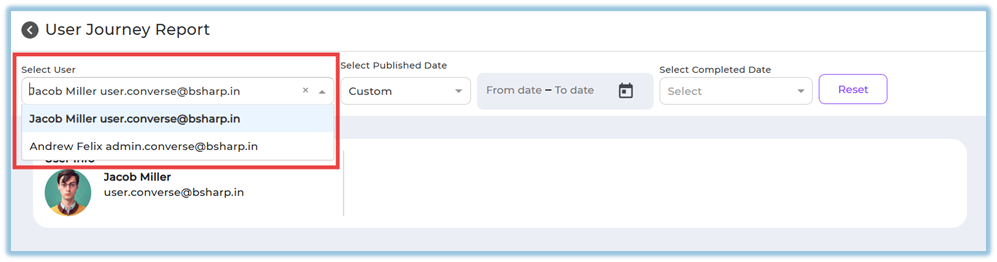
Select a value inSelect Published Dateto define the publication time range.Select a value inSelect Completed Dateto define the completion time range.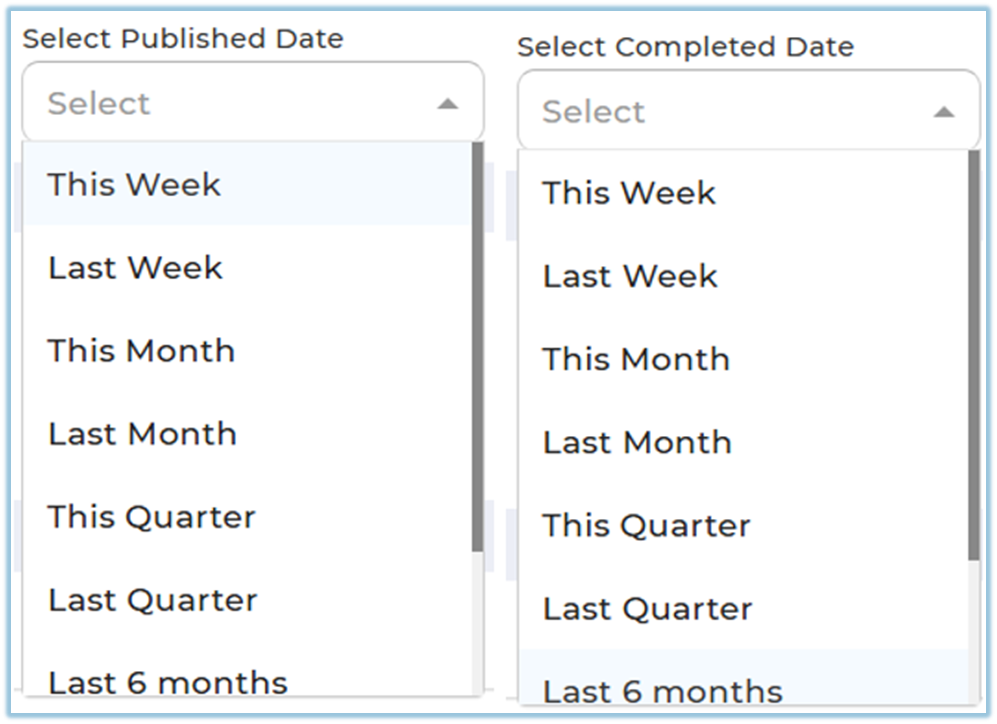
-
Click
ResetUser Activity Dashboardif you want to clearfrom theselectedlistfiltersofandavailablestart again.reports.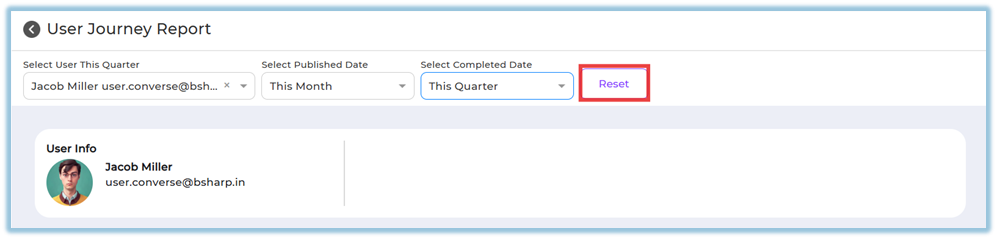
-
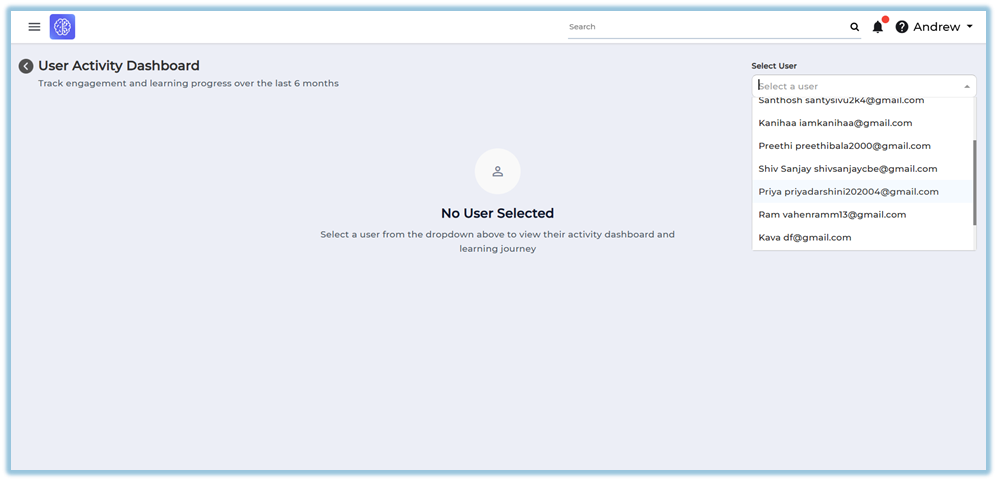
ReviewOn theUserrightInfosidesection displayed belowof thefilters.screen, click Select a user.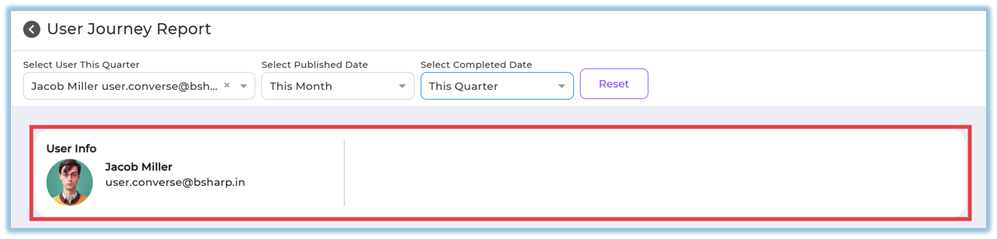
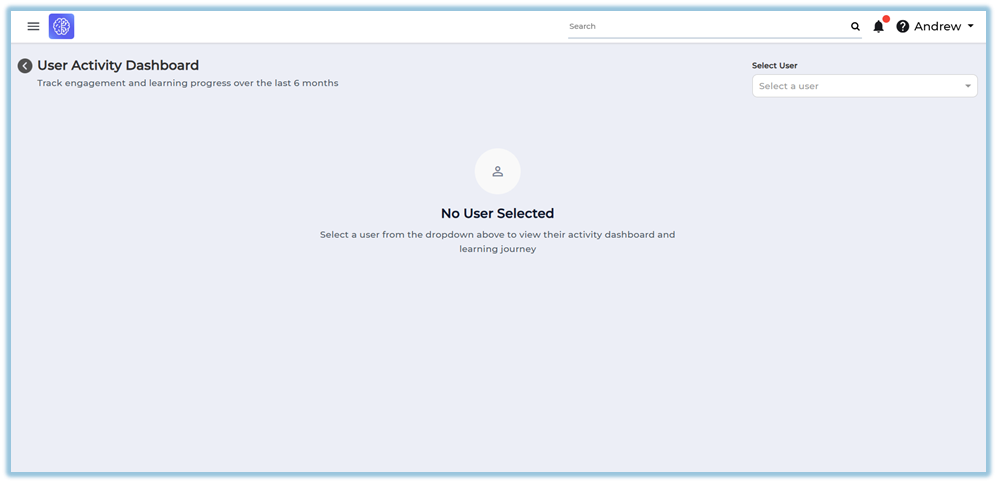
-
Choose a single user from the dropdown list.
-
View the
Moduleuser’sCompletionactivityStatusstatussectionpagetothatanalyzeappearspublishedautomaticallyandaftercompletedusermodules using graph or bar chart views.selection.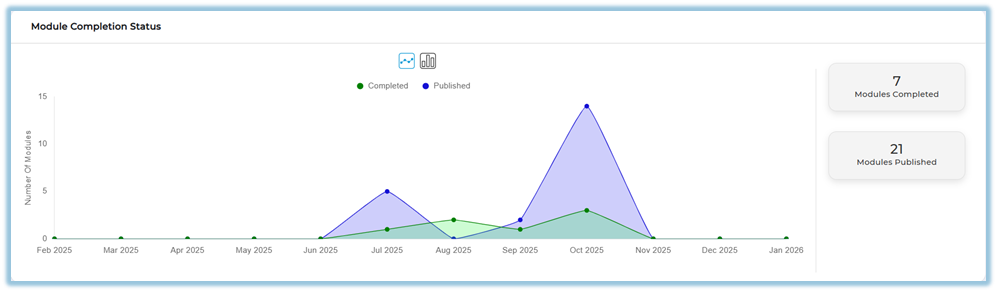
-
Scroll down to
reviewviewmodule-levelactivitydetailsstatus,underfeatureCompletedusage, points, module completion, and pathway completion details.
Not5. CompletedUser View
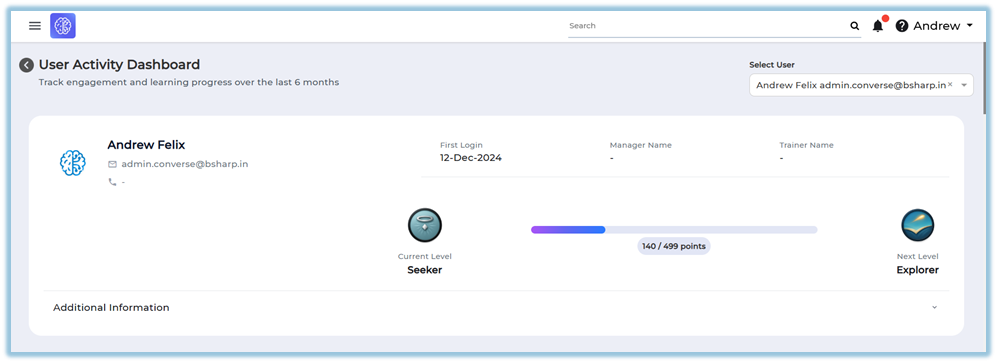
Once a user is selected, the dashboard displays the user’s profile information at the top, including username, email ID, mobile number, first login date, manager, and trainer. Below this, the page shows activity summaries, graphs, tables, and downloadable sections related to the selected user’s learning and engagement.
6. Reporting
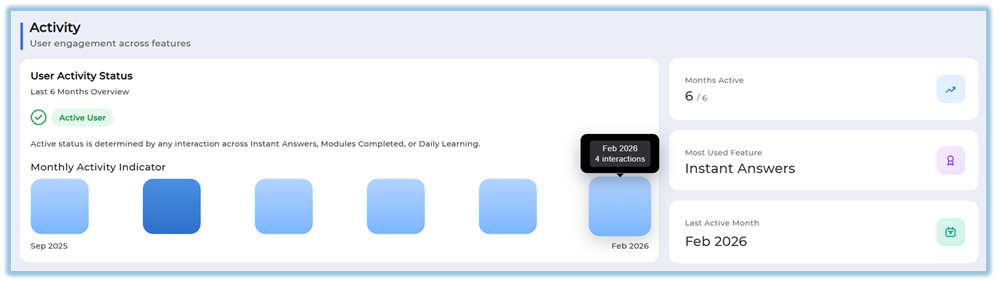
User Activity Dashboard
-
Displays the user’s activity status for the last six months, indicating whether the user is active or inactive.
-
-
A task is counted as an interaction when the user completes an action such as:
-
-
Completing a module
-
Completing a Learning of the Day (LoTD)
-
Using Instant Answers
-
-
The interaction count is calculated by adding all completed tasks across features.
-
-
Shows a monthly activity indicator highlighting the months in which the user was active.
-
Displays the most used feature and the user’s last active month.
-
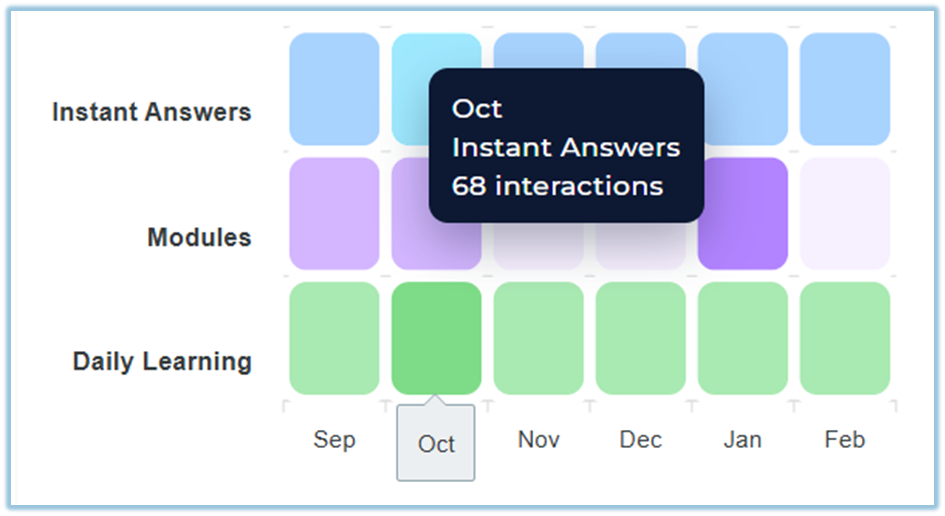
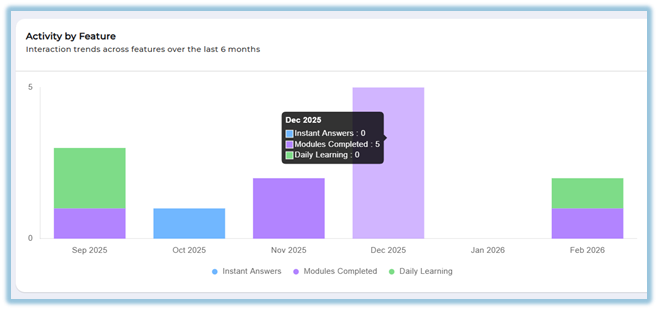
Provides an Activity by Feature section showing interactions across Instant Answers, Modules Completed, Modules, and Daily Learning.
-
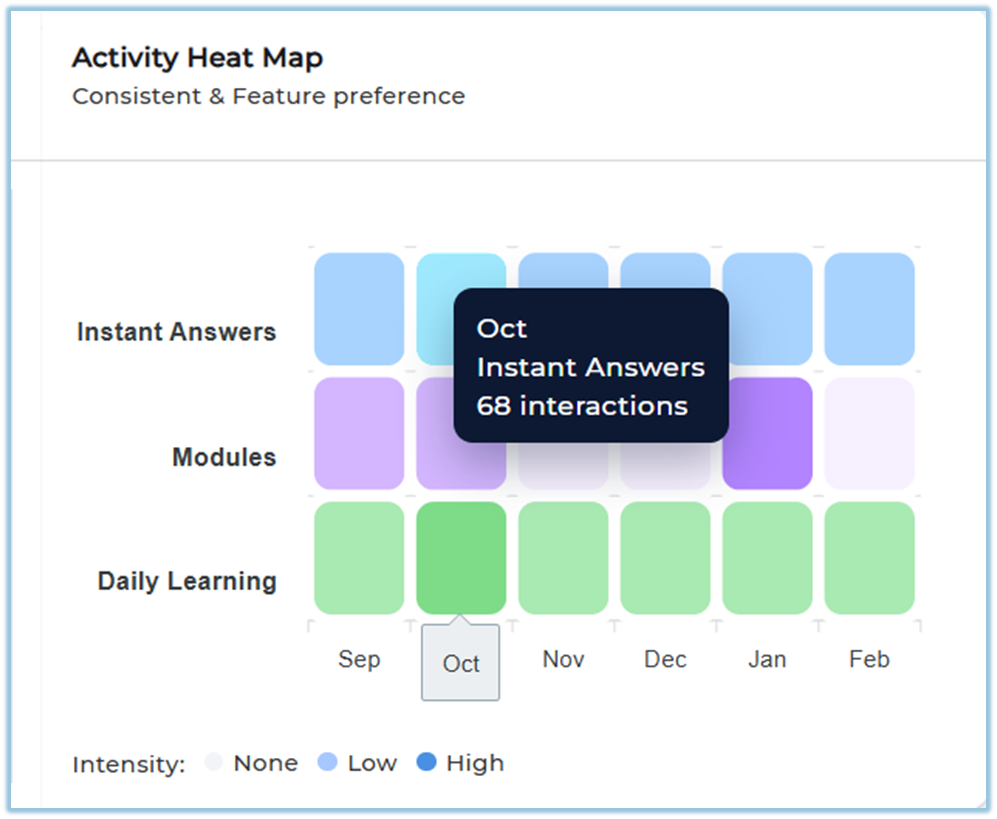
Includes an Activity Heat Map that visualizes consistency and feature preference over time.
-
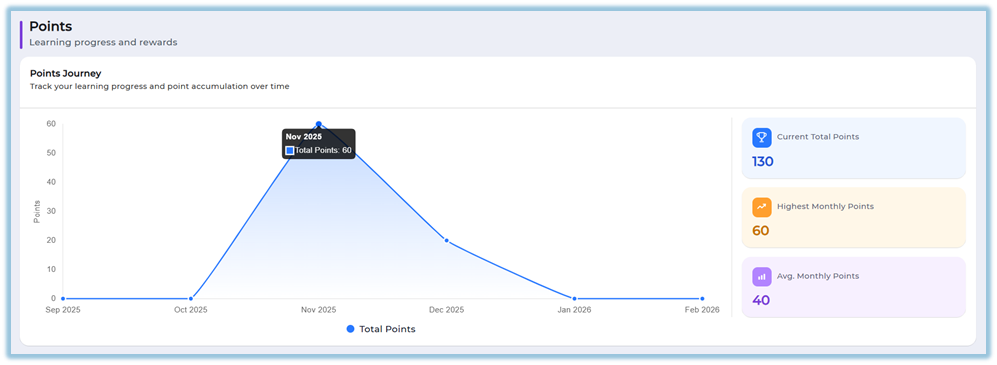
Shows a Points Journey graph representing total points earned over the last six months.
-
Displays current total points, highest monthly points, and average monthly points.
-
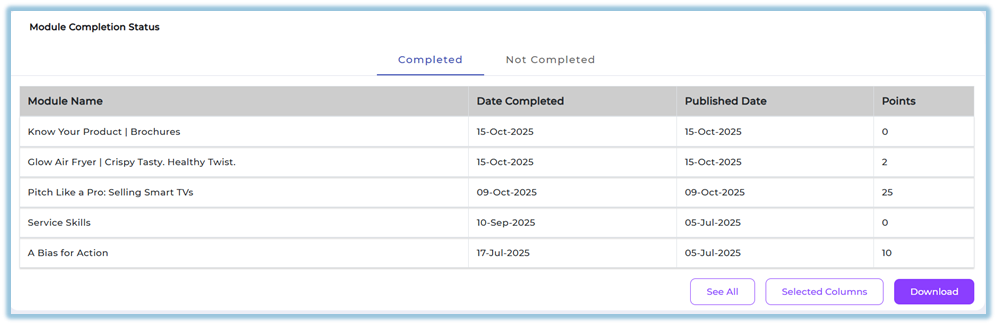
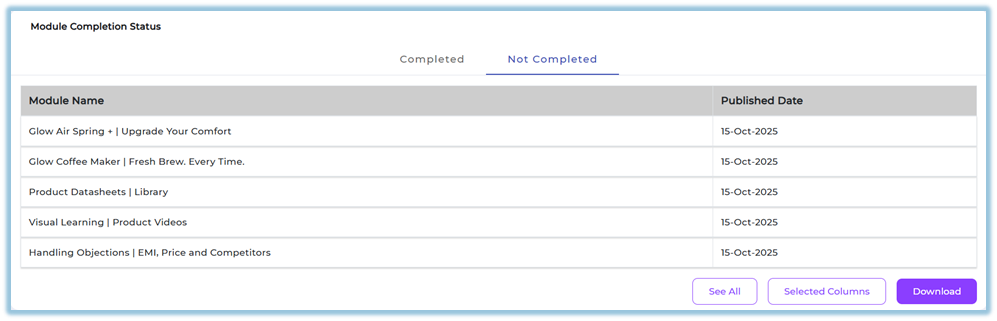
Includes a Module Completion section showing published and completed modules using bar or line graphs.
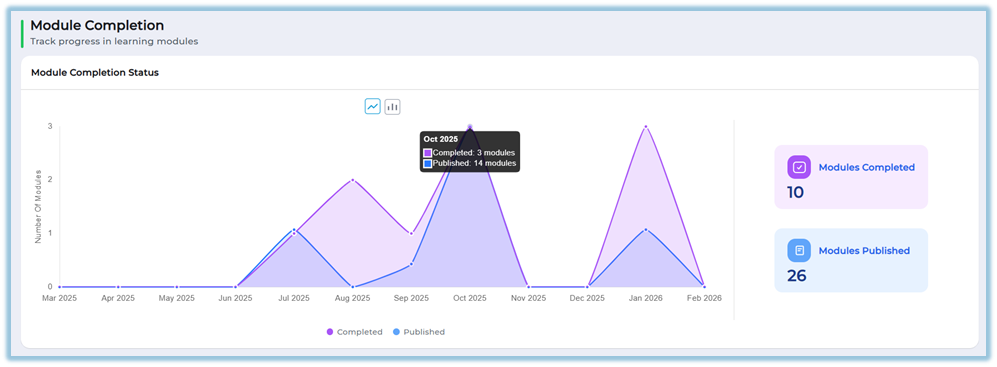
-
Allows switching between completed and not completed module data.
-
Click See All to
viewopen the complete module completion listofinmodulesafordetailedthetableuser.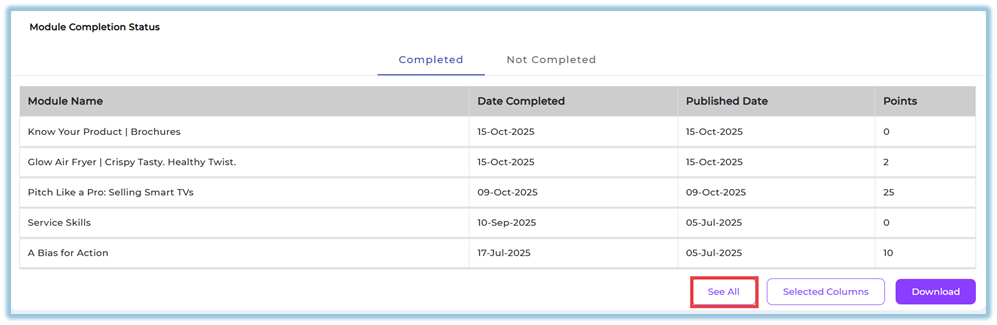
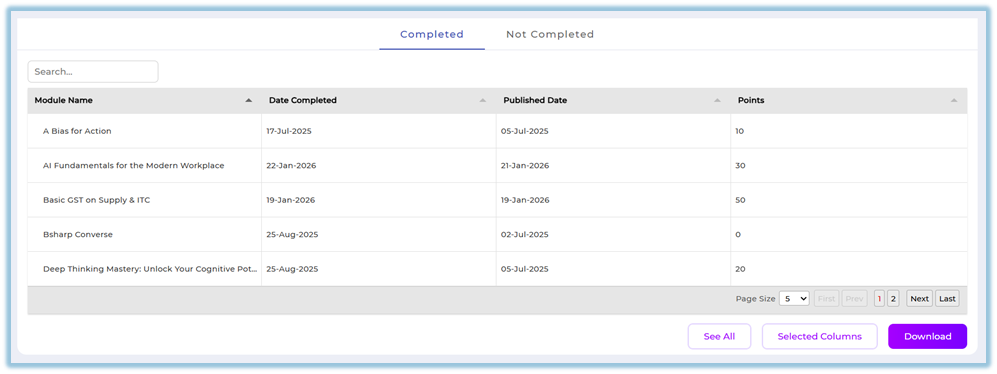
-
ClickProvides a searchable table showing module name, completion date, published date, points, and completion status. -
Apply date filters to control the time range of the displayed module data.
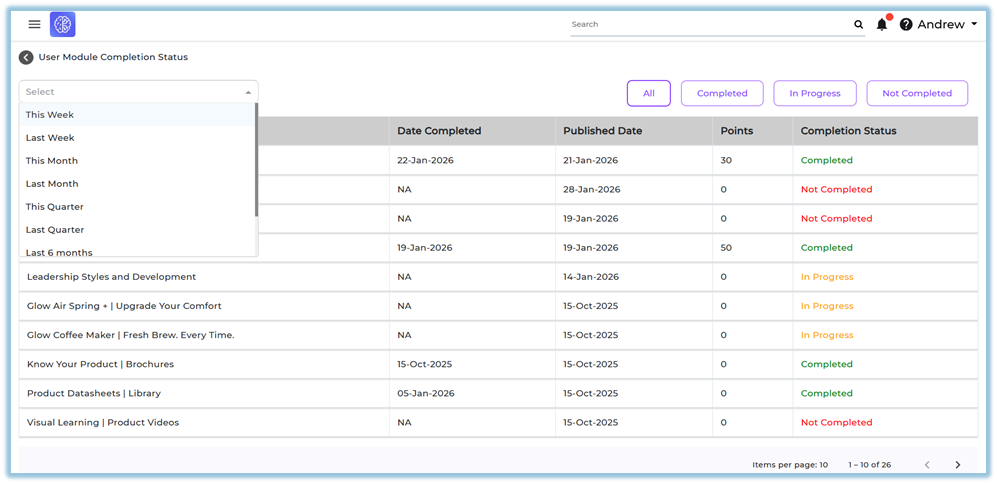
-
Use Selected Columns to choose
thewhich fieldsrequiredappear in the report.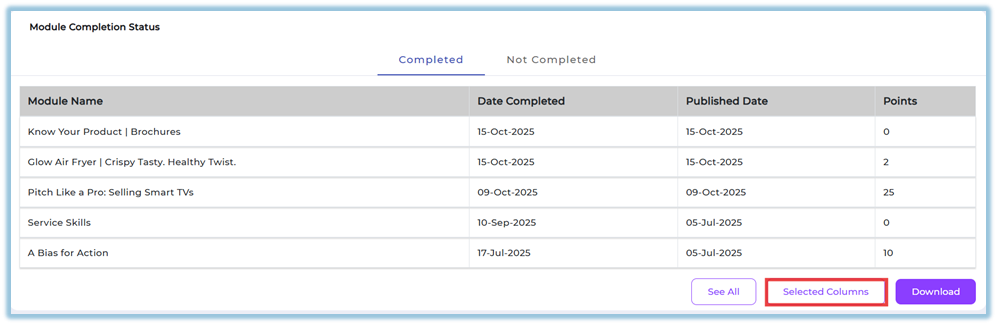

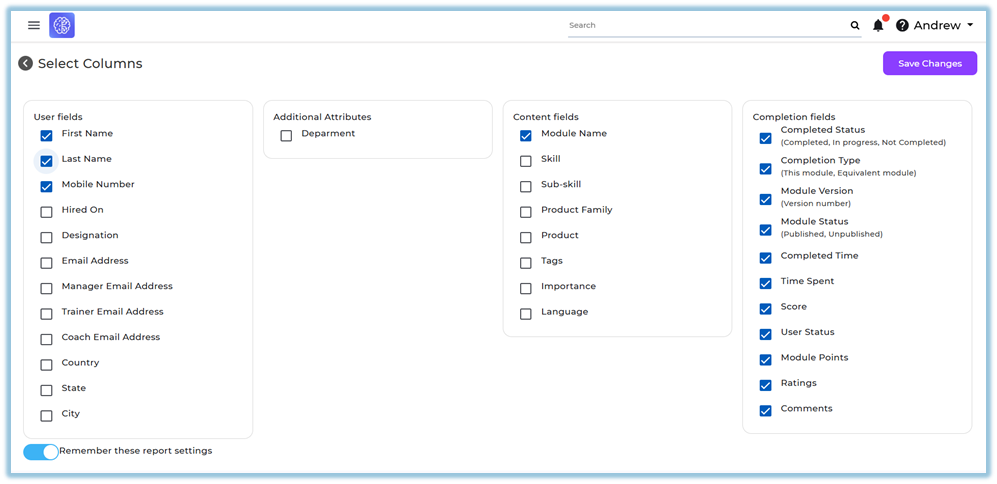
-
SelectDownload therequiredconfiguredfieldsdataandforclickofflineSavereviewChanges.or sharing.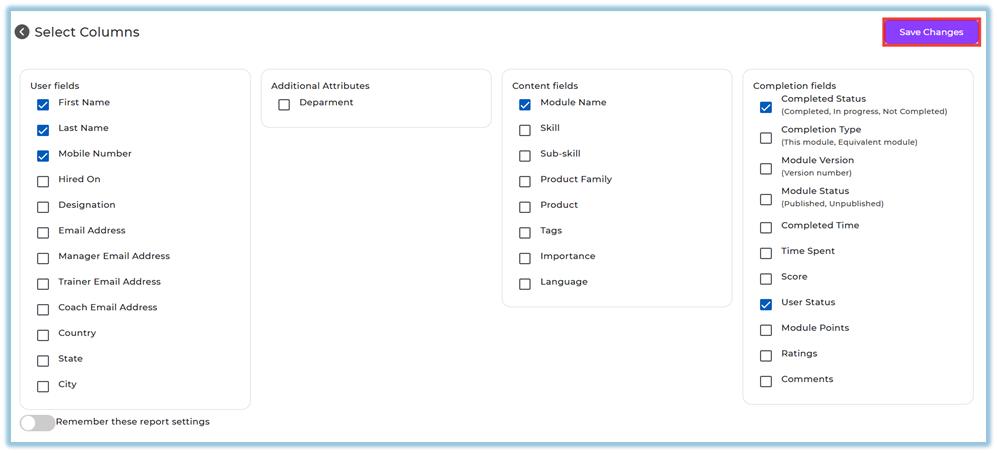
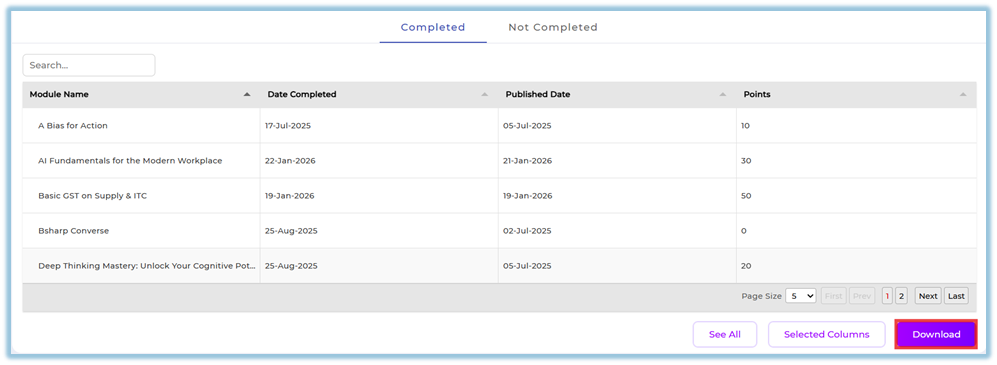
-
ClickIncludes aDownloadPathway Completion section showing priority pathways and overall pathways assigned toexportthereport based on the selected columns.user.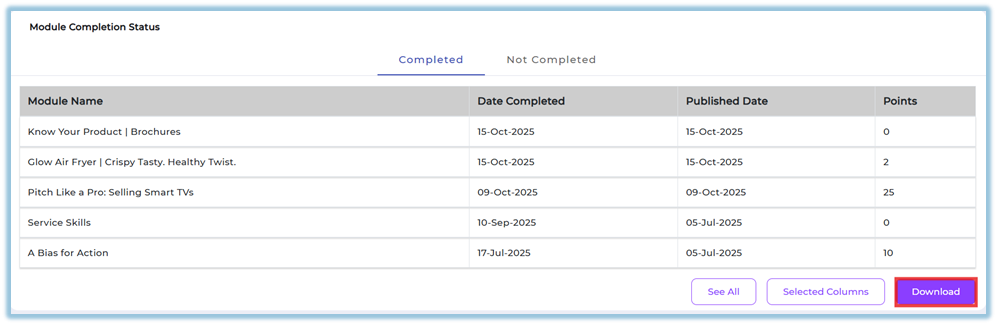
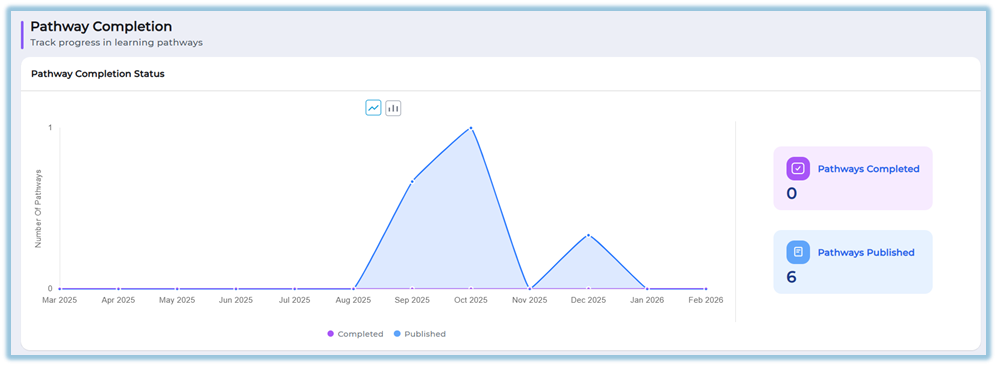
-
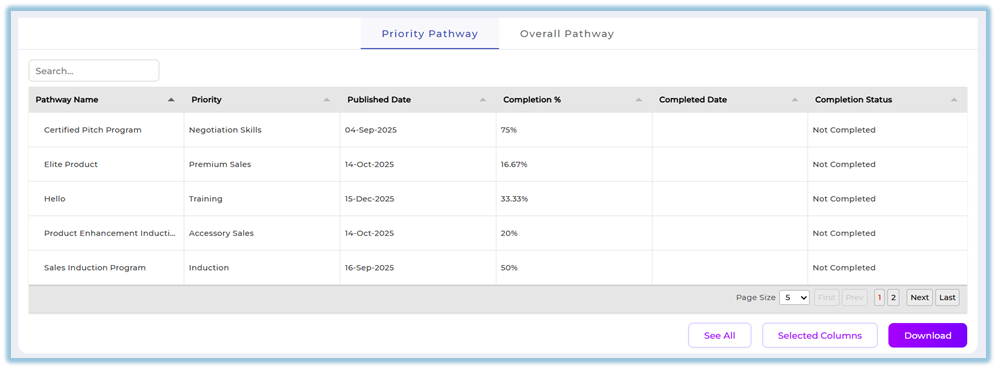
ScrollAllowsfurtherviewing,tofiltering,reviewcustomizingPathway Completion Status.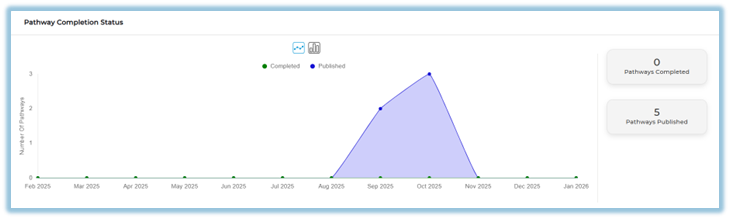
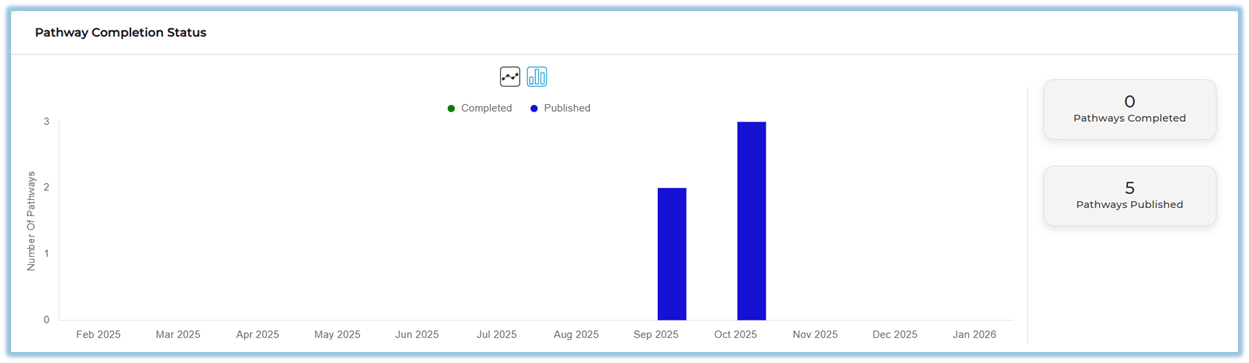
Switch betweenPriority Pathwaycolumns, andOverall Pathwaytabs to view pathway-level details.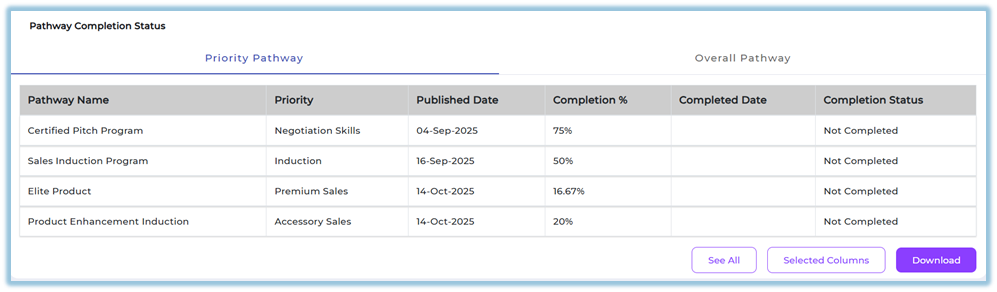
UseSee All,Selected Columns, andDownloadoptions to view and export pathway data as required.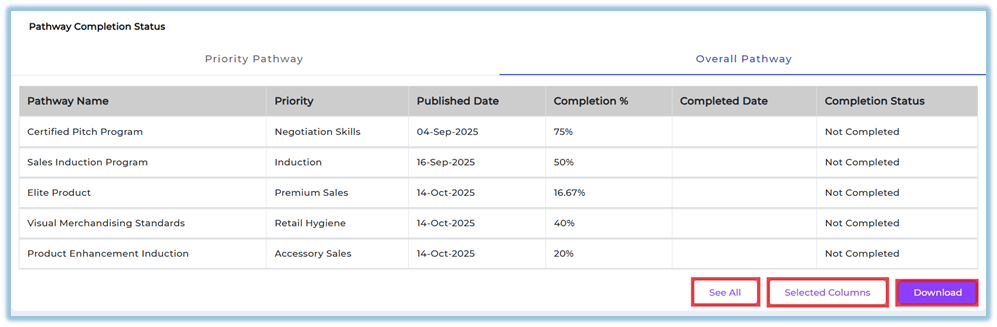
Module Completion Status: Shows the number of modules published versus completed for the selected user over time.data.Pathway Completion Status: Shows published versus completed pathways using graphical views.Priority Pathway Report: Displays priority-based pathways with completion details.Overall Pathway Report: Displays all assigned pathways and their completion status.Reportsreport can bedownloadedaccessedusing thefromDownloadReports → User Activity Dashboardoption after selecting required columns..
https://converse.bsharpcorp.com/celebrate/individual_user_reports/489
5. User View
After selecting the user and filters, the page displays the user’s profile information, module completion trends, detailed module status, anddownloading pathway completion details. Users with access can visually switch between graph and bar chart views and review completion information without making any configuration changes.
6. Reporting
ModuleThe Details Table: Displays module name, published date, completion percentage, completed date, and completion status.
7. Best Practices
-
activityAlwaysSelectselectonebothuserpublishedatandacompletedtimedatetoranges forensure accurateanalysis. UseSelected Columnsto download only relevant data fields.Review both module and pathway sections for a complete understanding of user progress.tracking.-
Use graph
viewstoggleforoptionstrendtoanalysiscompareandtrendstablevisually.views -
detailedCustomize
verificationreport columns before downloading to avoid unnecessary data. -
Apply date filters to focus on a specific time range when reviewing activity.
8. Related Links / FAQs
-
Q:WhoCancanI view multiple users at once in this report?A: No,access the UserJourneyActivityReportDashboard?
Only administrators can access the User Activity Dashboard. This report isdesignednotforavailableonetouserteamat a time.users. Q: Can I change the report columns before downloading?A: Yes, use theSelected Columnsoption before downloading.
9. Version Notes
Last Updated: 59 JanFeb 2026