
User Activity Dashboard
1. Overview
The User Activity Dashboard is a report available under the Reports section that allows administrators to view engagement and learning progress details for a single user over the last six months. It consolidates activity, learning interactions, points earned, module completion, and pathway progress into one dashboard view.
2. When to Use
-
When you need to review the learning activity of a specific user over the last six months.
-
When you want to understand how actively a user is engaging with different learning features.
-
When you need to check module and pathway completion status for an individual user.
-
When you want to download user-level learning and activity data.
3. Concepts
-
Reports section – The area in Converse where all downloadable and viewable reports are available.
-
User selection – A dropdown used to choose a single user whose activity data will be displayed.
-
User profile details – Basic information shown for the selected user, including contact and role details.
-
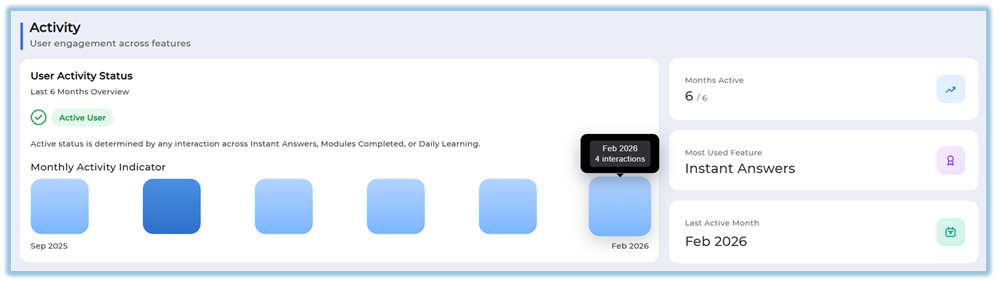
Activity overview – A summary of the user’s engagement status over the last six months.
-
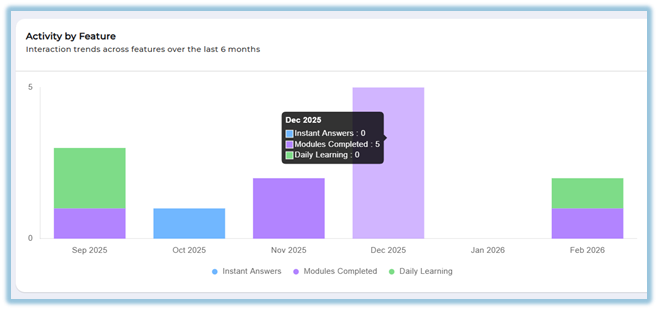
Activity by feature – A breakdown of interactions across learning features such as modules and daily learning.
-
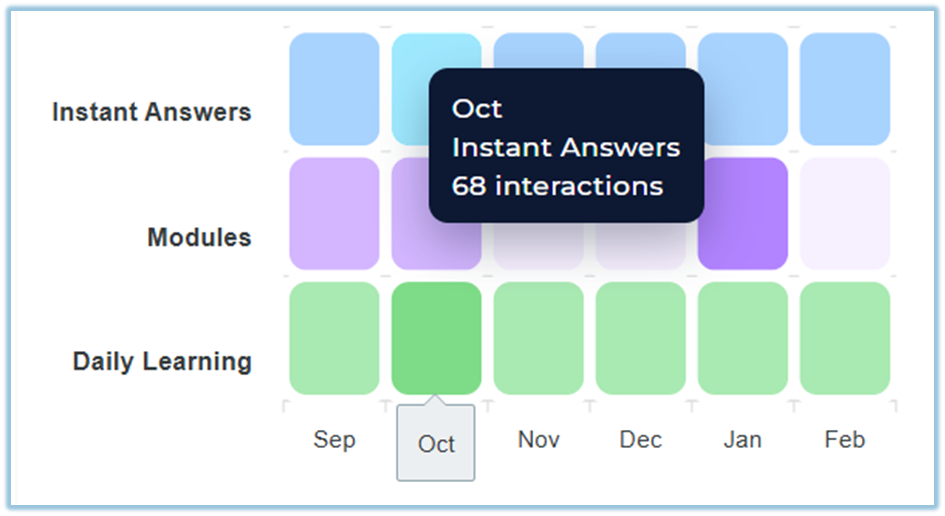
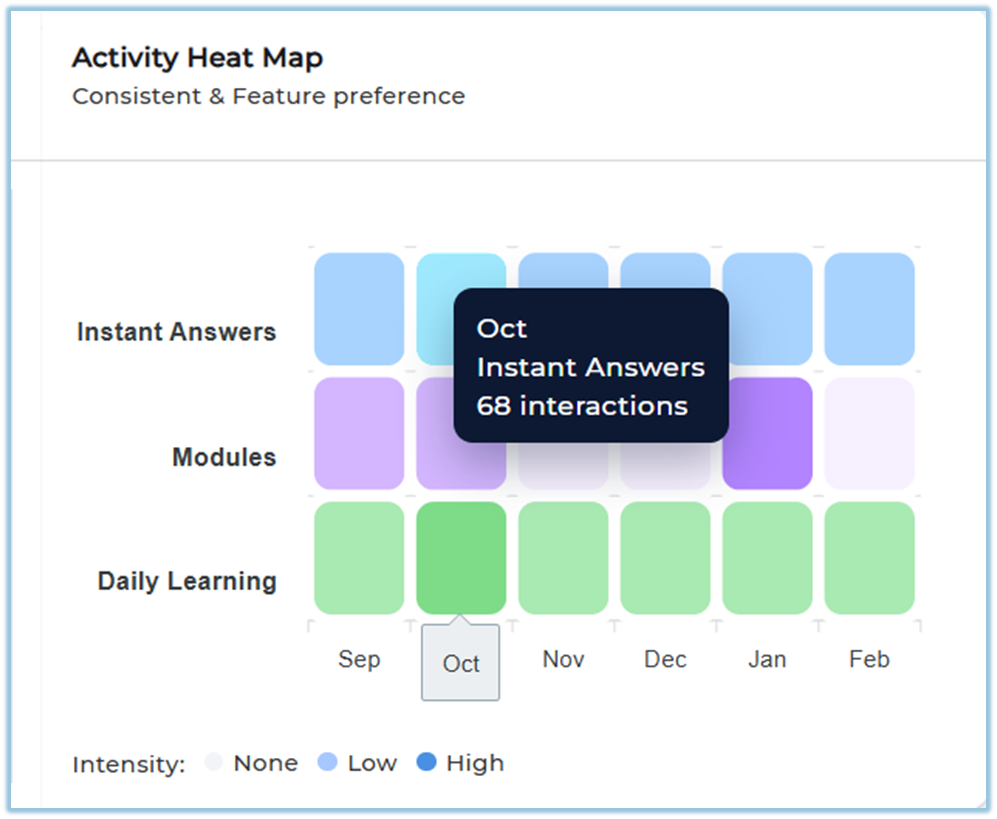
Activity heat map – A visual indicator showing consistency and feature usage intensity over time.
-
Points and rewards – A summary of points earned by the user during the last six months.
-
Module completion – Details of completed, in-progress, and not completed learning modules.
-
Pathway completion – Progress tracking for priority and overall learning pathways assigned to the user.
-
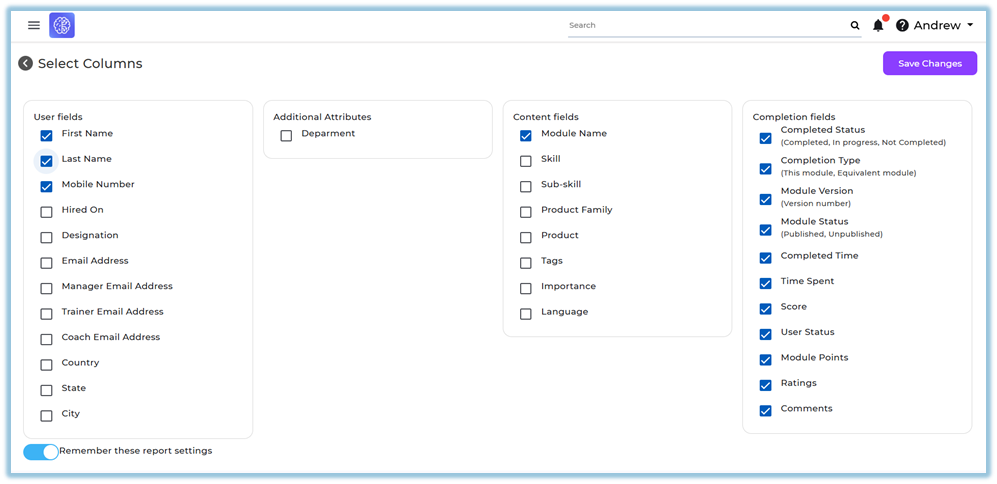
Column customization – An option to select which data fields appear in downloadable reports.
-
Data download – The ability to export user activity data for offline review.
4. Set Up Guide
-
Click the three-line main menu from the homepage.
-
Click Reports to open the reports landing page.
https://converse.bsharpcorp.com/celebrate/user-report-page -
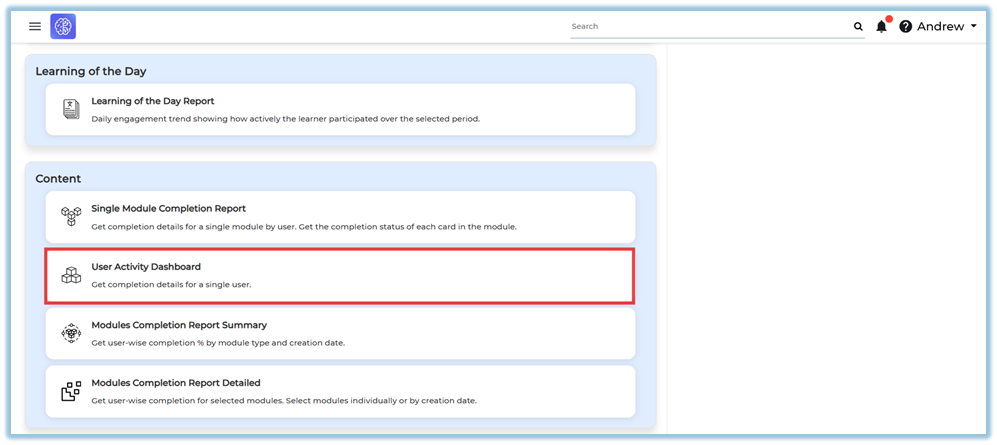
Locate the Content section within Reports.
https://converse.bsharpcorp.com/celebrate/individual_user_reports/489 -
Click User Activity Dashboard from the list of available reports.
-
On the right side of the screen, click Select a user.
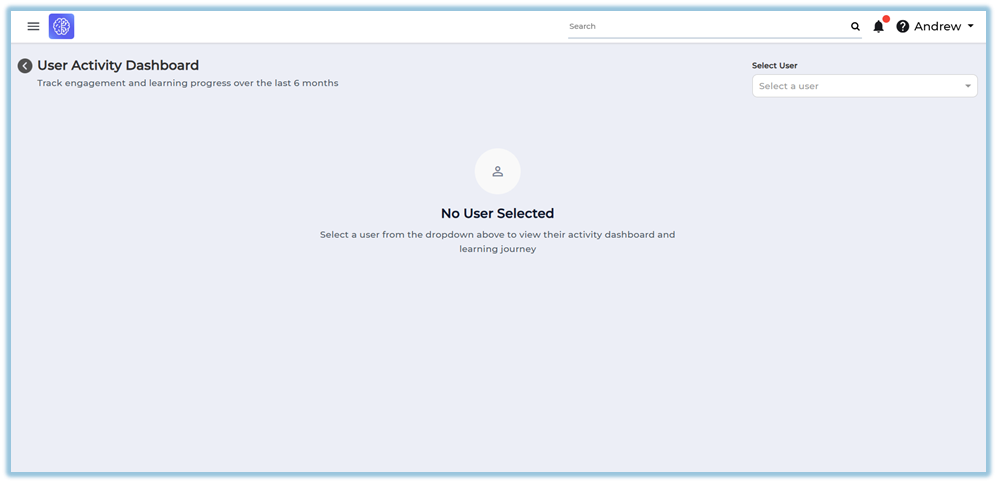
-
Choose a single user from the dropdown list.
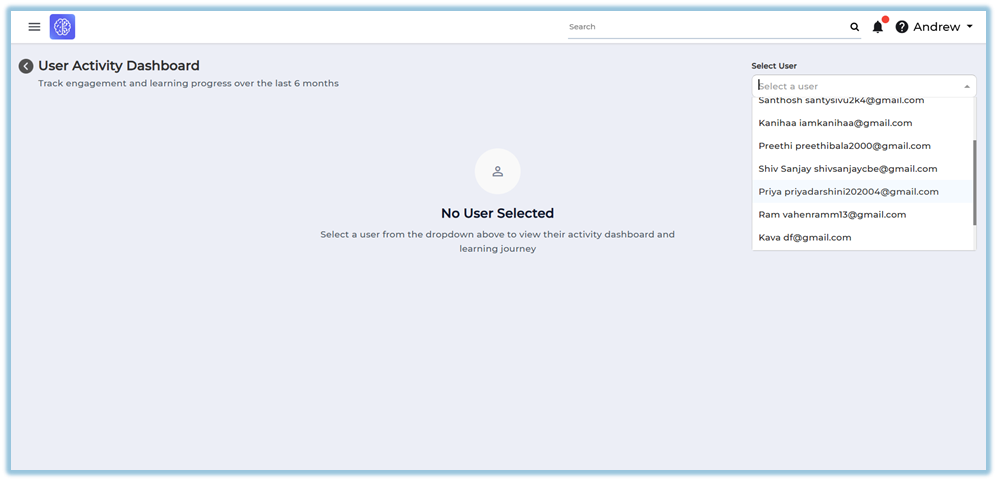
-
View the user’s activity status page that appears automatically after user selection.
-
Scroll down to view activity status, feature usage, points, module completion, and pathway completion details.
5. User View
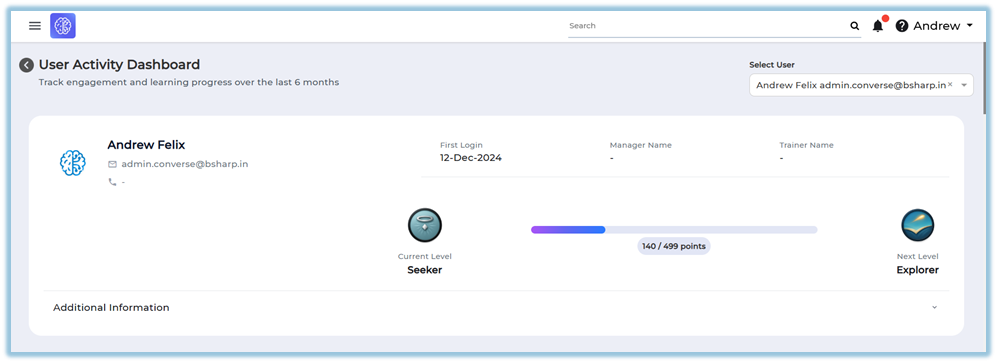
Once a user is selected, the dashboard displays the user’s profile information at the top, including username, email ID, mobile number, first login date, manager, and trainer. Below this, the page shows activity summaries, graphs, tables, and downloadable sections related to the selected user’s learning and engagement.
6. Reporting
User Activity Dashboard
-
Displays the user’s activity status for the last six months, indicating whether the user is active or inactive.
-
Interactions represent the total number of learning tasks completed by the user.
-
A task is counted as an interaction when the user completes an action such as:
-
-
Completing a module
-
Completing a Learning of the Day (LoTD)
-
Using Instant Answers
-
-
The interaction count is calculated by adding all completed tasks across features.
-
-
Shows a monthly activity indicator highlighting the months in which the user was active.
-
Displays the most used feature and the user’s last active month.
-
Provides an Activity by Feature section showing interactions across Instant Answers, Modules Completed, Modules, and Daily Learning.
-
Includes an Activity Heat Map that visualizes consistency and feature preference over time.
-
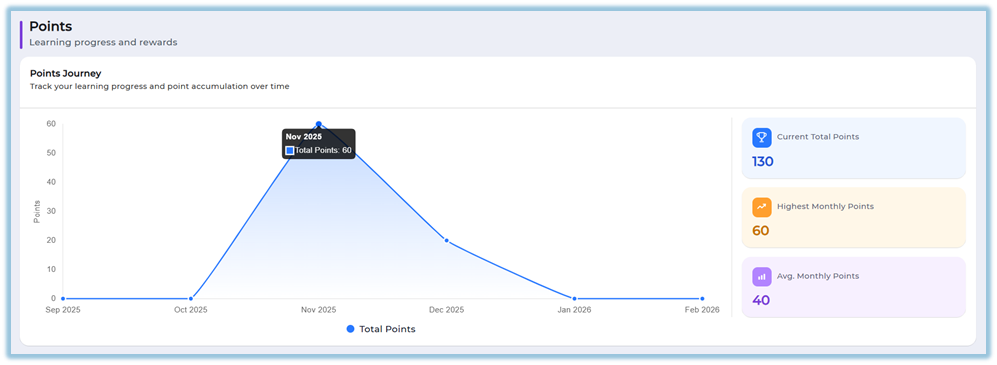
Shows a Points Journey graph representing total points earned over the last six months.
-
Displays current total points, highest monthly points, and average monthly points.
-
Includes a Module Completion section showing published and completed modules using bar or line graphs.
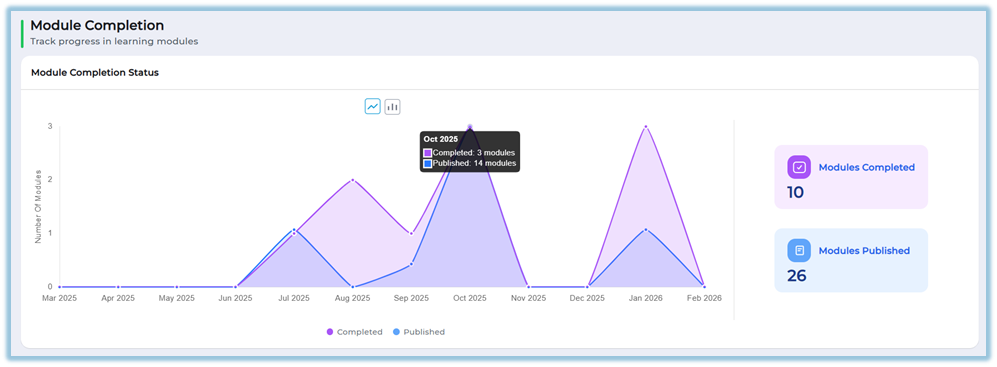
-
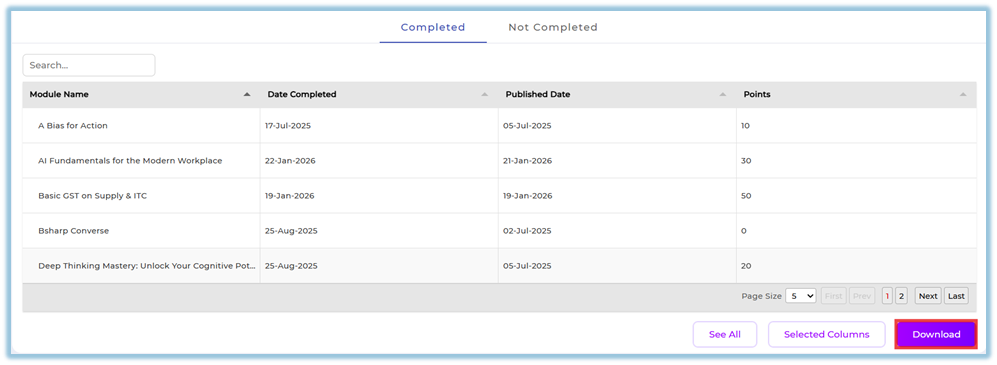
Allows switching between completed and not completed module data.
-
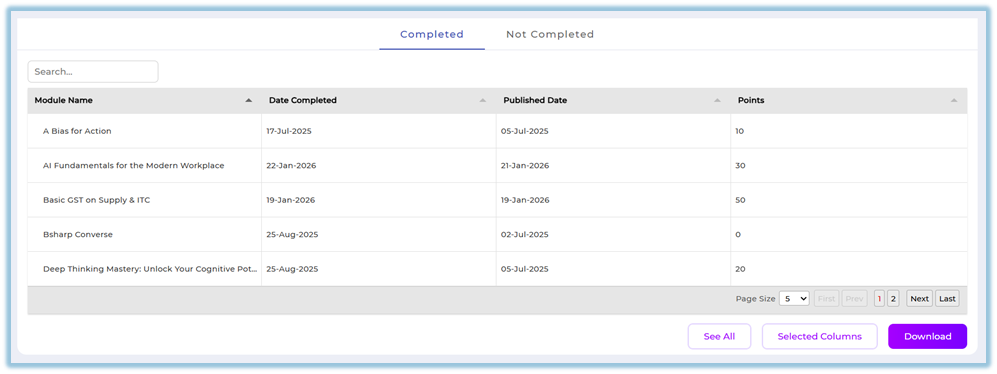
Click See All to open the complete module completion list in a detailed table view.
-
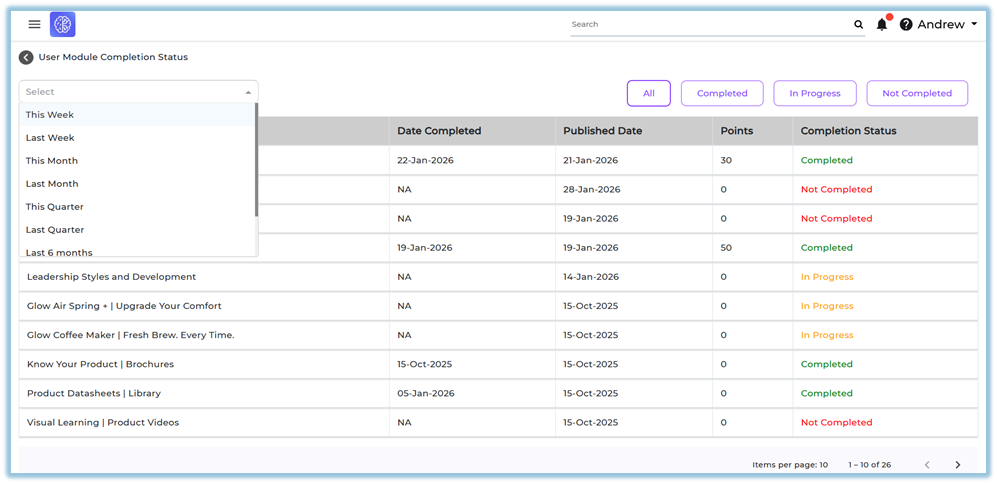
Provides a searchable table showing module name, completion date, published date, points, and completion status.
-
Apply date filters to control the time range of the displayed module data.
-
Use Selected Columns to choose which fields appear in the report.
-
Download the configured data for offline review or sharing.
-
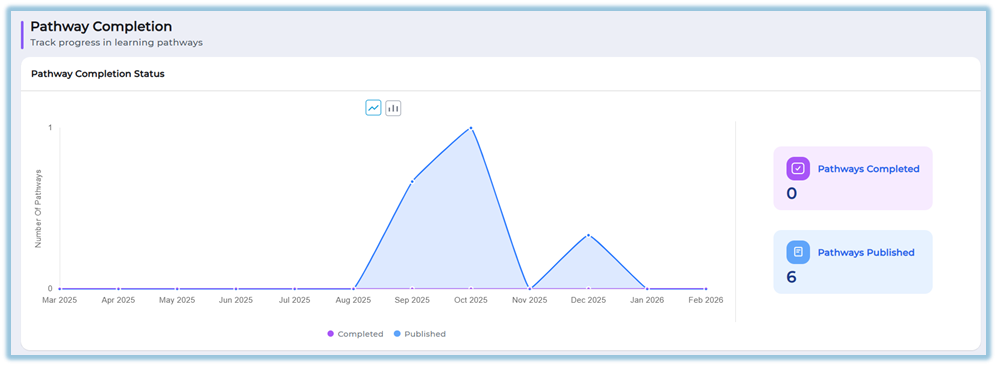
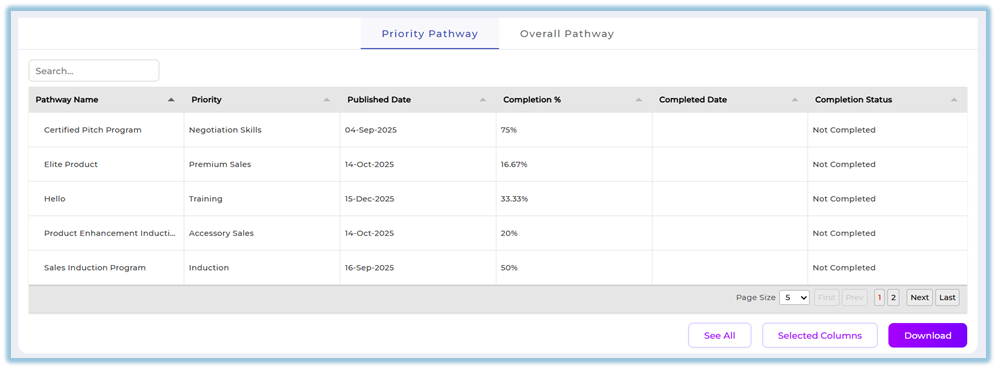
Includes a Pathway Completion section showing priority pathways and overall pathways assigned to the user.
-
Allows viewing, filtering, customizing columns, and downloading pathway completion data.
The report can be accessed from Reports → User Activity Dashboard.
https://converse.bsharpcorp.com/celebrate/individual_user_reports/489
7. Best Practices
-
Select one user at a time to ensure accurate activity tracking.
-
Use graph toggle options to compare trends visually.
-
Customize report columns before downloading to avoid unnecessary data.
-
Apply date filters to focus on a specific time range when reviewing activity.
8. Related Links / FAQs
Who can access the User Activity Dashboard?
Only administrators can access the User Activity Dashboard. This report is not available to team users.
9. Version Notes
Last Updated: 9 Feb 2026
No Comments