
Learning Pathway Master Report
1. Overview
The Learning Pathway Master Report provides a consolidated view of pathway performance across the organization. It helps track completion status, compare pathway types (Normal and Mandatory), and analyze learning progress using filters and summary insights.
2. When to Use
- When tracking completion status of all learning pathways
- When monitoring Mandatory vs Normal pathway performance
- When reviewing recent pathway trends based on time period
- When analyzing completion across teams or attributes
3. Concepts
-
Pathway Created Date – Filters pathways based on when they were created in the system.
-
Custom Date Range – Allows selecting a specific start and end date for analysis.
- Pathway Type (Normal / Mandatory) – Defines whether the pathway is a regular learning pathway or a mandatory one that must be completed within a set timeline.
-
Attribute Filter – Narrows report data using user attributes like department or location.
-
Company Tab – Displays pathway completion data for all users in the organization.
-
Team Tab – Displays pathway completion data only for users mapped to the manager, trainer, or mentor.
-
Last 10 Pathways – Shows completion status of the most recently published pathways.
-
Average Completion % – Indicates the overall average completion percentage across pathways.
-
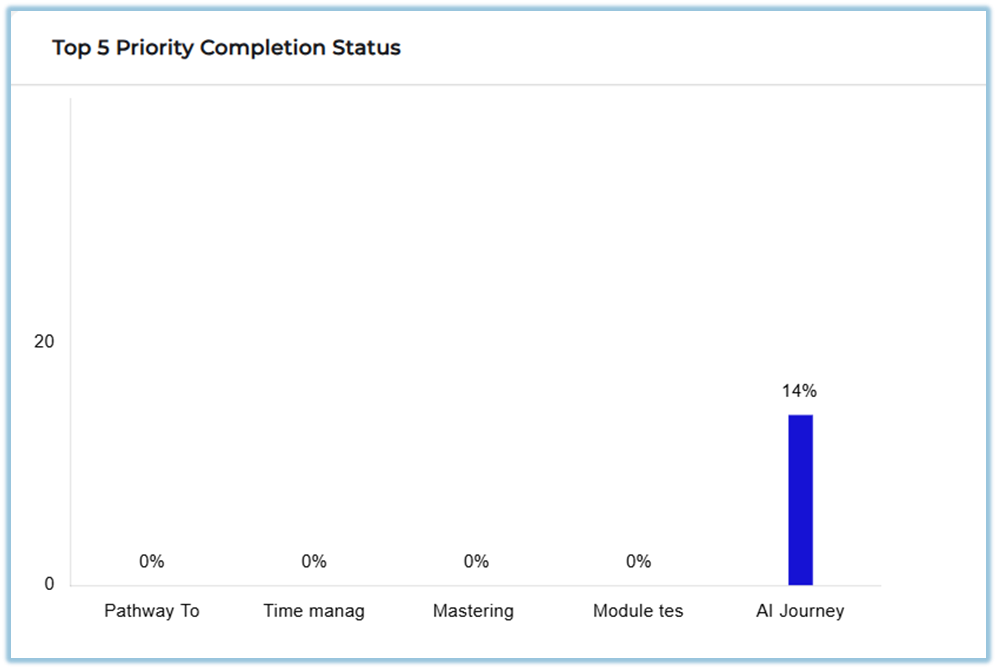
Top 5 Priority Pathways – Highlights completion status of pathways marked as top priorities.
-
Pathway Completion Status – Shows completion percentage for each pathway.
-
Pathway Drill-down – Allows navigation to the individual pathway completion report.
-
See All – Opens a detailed view of all pathway records.
-
Download Report – Exports pathway completion data for offline review.
4. Set Up Guide
-
Open Menu and navigate to Reports.
https://converse.bsharpcorp.com/celebrate/user-report-page -
Under Learning Pathway, select Learning Pathway Master Report.
https://converse.bsharpcorp.com/celebrate/pathway_master_report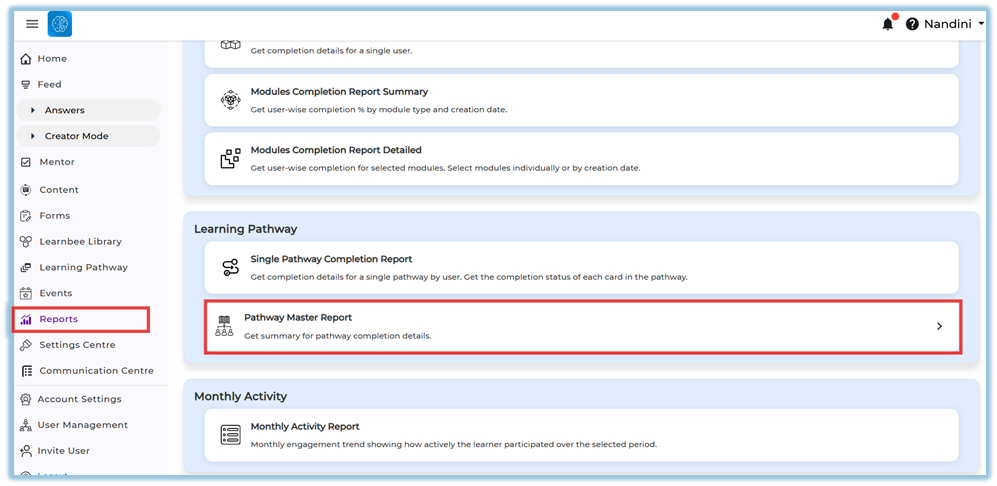
-
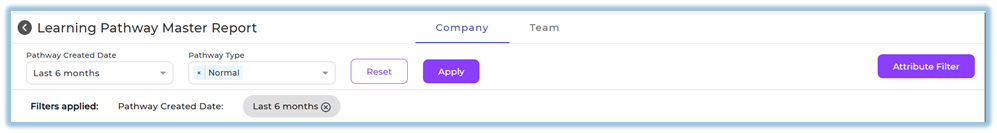
Select Pathway Created Date
Choose predefined range OR custom date
-
Select Pathway Type
- Normal
- Mandatory
-
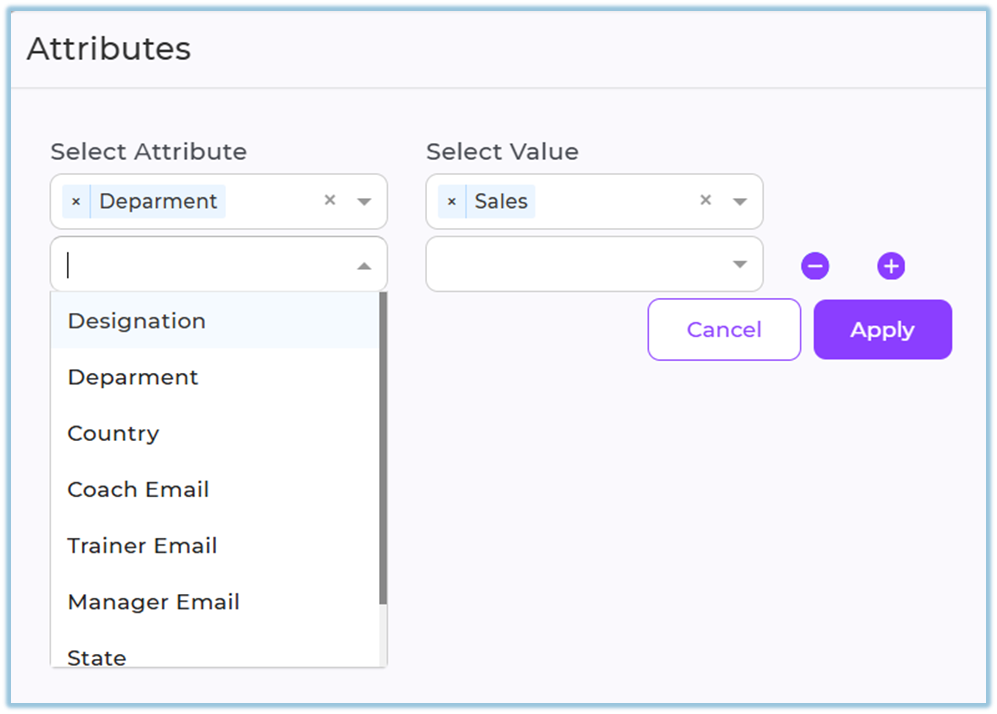
Click Attribute Filter (optional)
- Select attribute (Department, Role, etc.)
- Select values
- Click Apply
-
Click Apply to load the filtered report data.
-
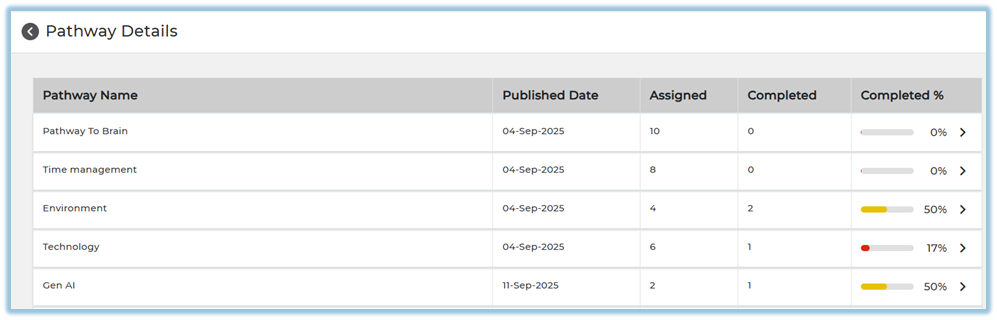
Review the dashboard summary, including average completion percentage and recent pathway completion trends.
-
View the last 10 published pathways and their completion percentages displayed on the dashboard.
-
Review priority pathway completion status shown for the top priority pathways.
-
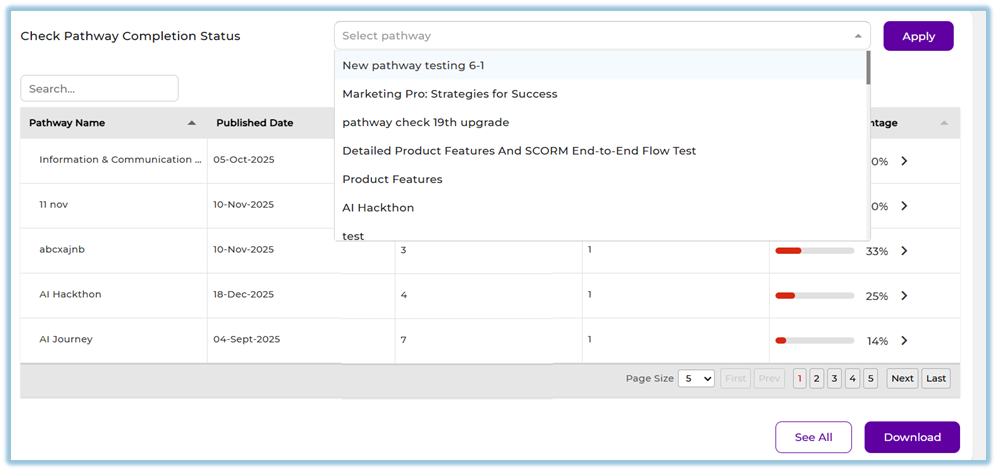
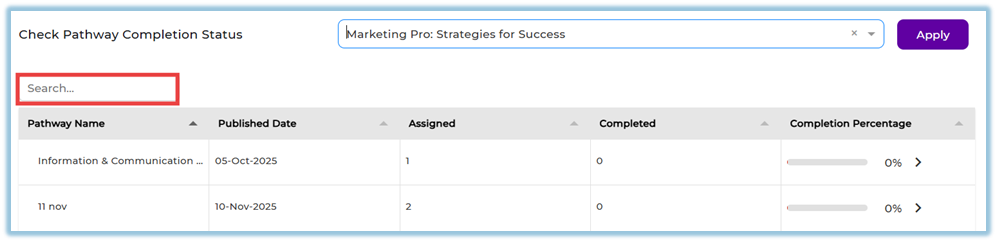
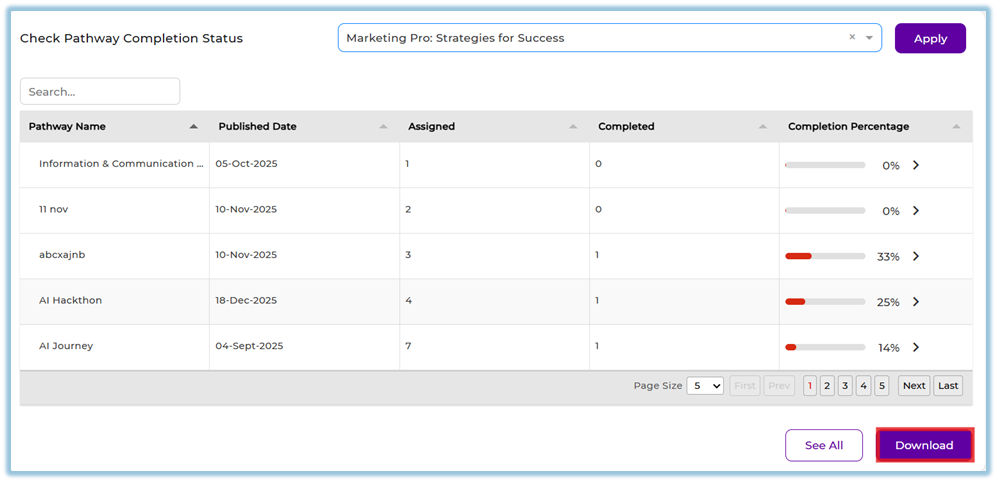
In Check Pathway Completion Status, select a Pathway to view its completion details.
-
Use the Search option to find a specific pathway (reset filters before searching if required).
-
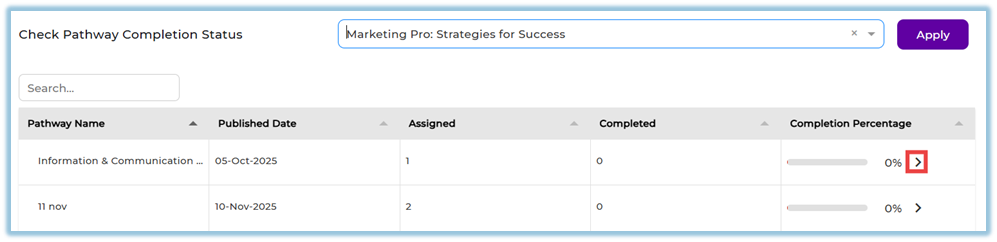
Click the arrow icon next to a pathway to open the Single Pathway Completion Report.
-
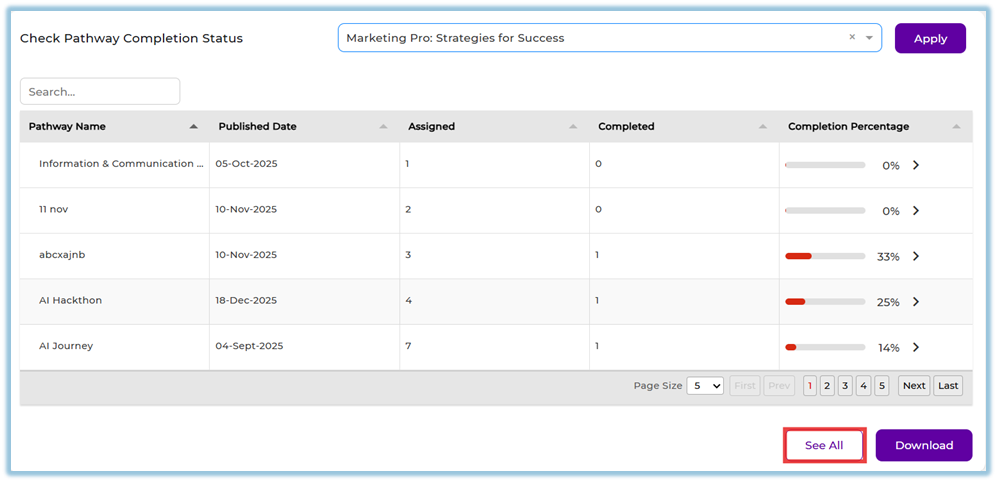
Use See All to view all pathway details.
-
Click Download to export the report.
5. User View
Admins can view all pathways and completion data in the Company tab.
Managers, Trainers, and Mentors can view only their mapped users’ pathway data in the Team tab.
Completion charts, percentages, and summaries are visible based on access level.
6. Reporting
- Tracks pathway performance using Pathway Master Report
- Supports Normal & Mandatory Pathway filtering
- Displays pathway-wise completion percentages
-
Shows average completion across all pathways
-
Highlights priority pathway performance
-
Supports drill-down to individual pathway reports
7. Best Practices
-
Use date filters to analyze relevant time periods
-
Apply attributes to focus on specific user groups
-
Regularly monitor priority pathway completion
-
Use drill-down reports for deeper analysis
8. Related Links / FAQs
Can I see user-level completion here?
No, this report shows pathway-level summary data.
Why is some data not visible to me?
Visibility depends on Company or Team tab access.
9. Version Notes
Last Updated: 25 Mar 2026
No Comments