
Monthly Activity Report
1. Overview
The Monthly Activity Report provides a consolidated view of user engagement across the platform. It displays activity trends, feature usage, completion metrics, inactive users, publishing trends, and leaderboards using visual dashboards and summary cards.
2. When to Use
-
When you want to review overall engagement across the organization.
-
When analyzing feature usage trends such as Instant Answers, Daily Learning, and Content.
-
When tracking module and pathway completion trends.
-
When identifying inactive users or reviewing monthly leaderboard performance.
3. Concepts
-
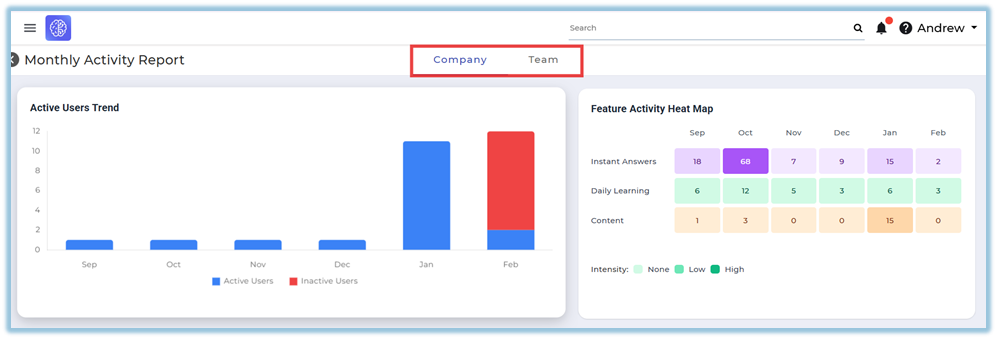
Company Tab – Displays activity data for the entire organization.
-
Team Tab – Displays activity data limited to users mapped to the viewer.
-
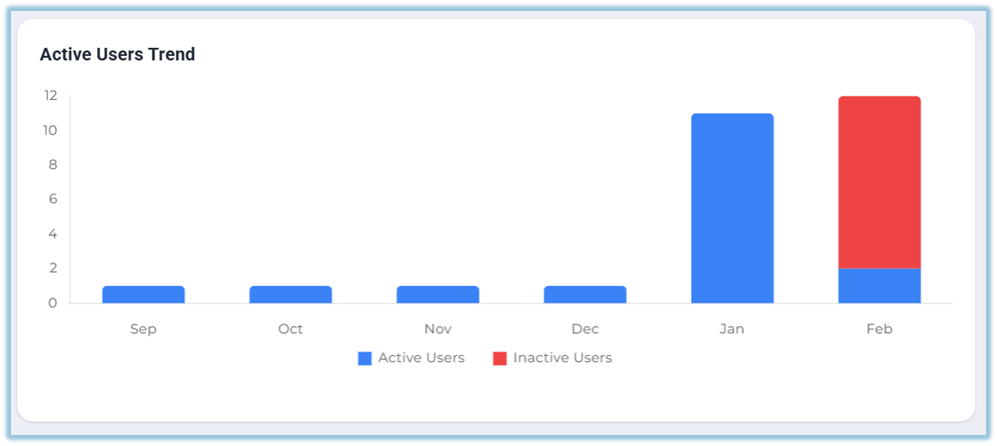
Active Users Trend – Shows monthly active and inactive user comparison.
-
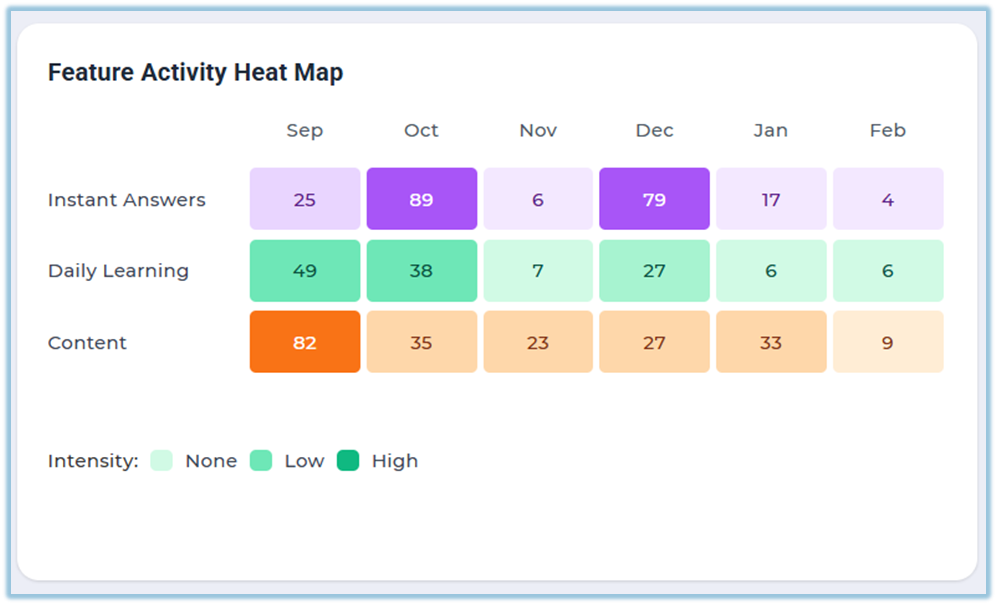
Feature Activity Heat Map – Displays usage intensity across features.
-
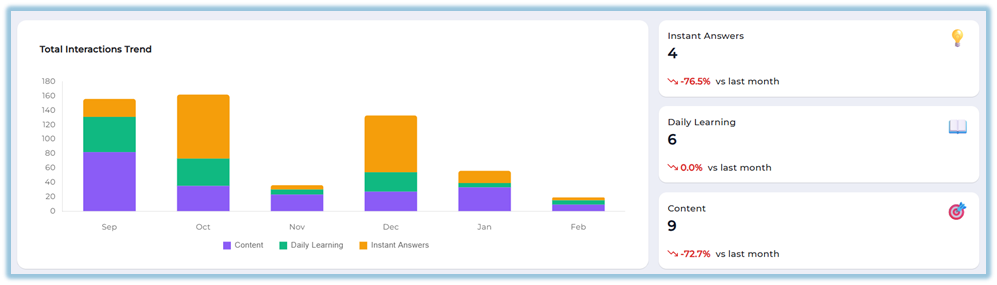
Total Interactions Trend – Shows total completed interactions across features.
-
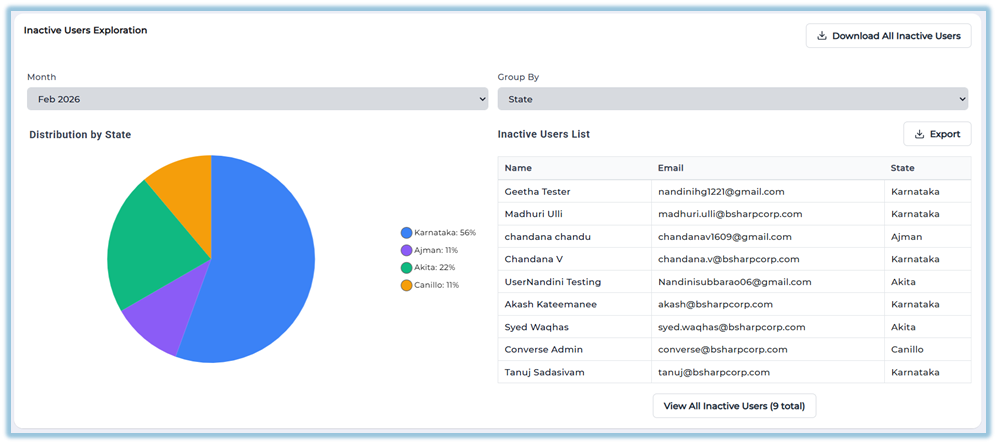
Inactive Users Exploration – Displays inactive user distribution and detailed list.
-
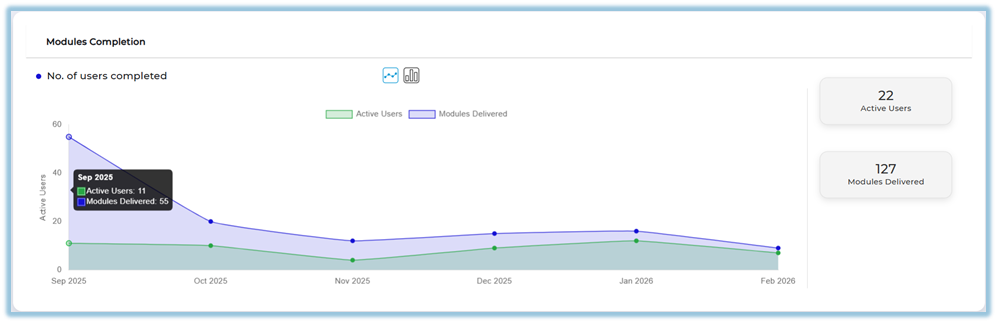
Modules Completion – Shows number of users completed and modules delivered.
-
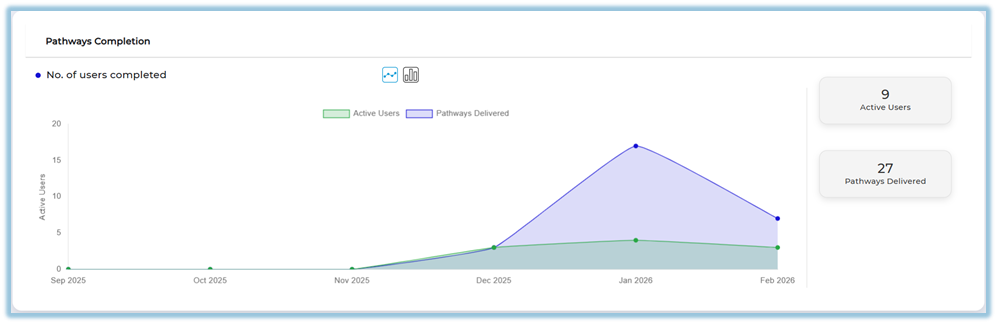
Pathways Completion – Displays pathway delivery and completion trends.
-
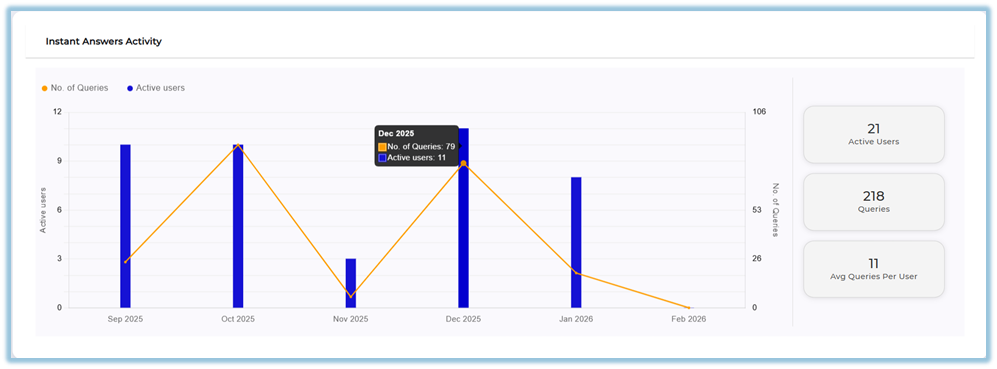
Instant Answers Activity – Shows query count and active users.
-
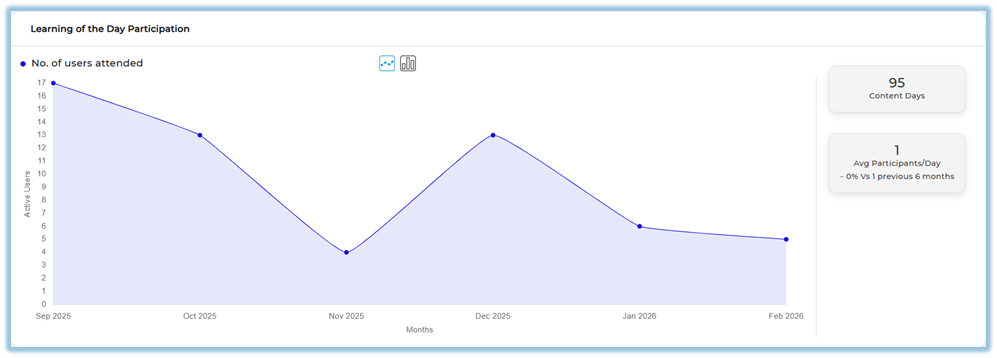
Learning of the Day Participation – Displays participation trends.
-
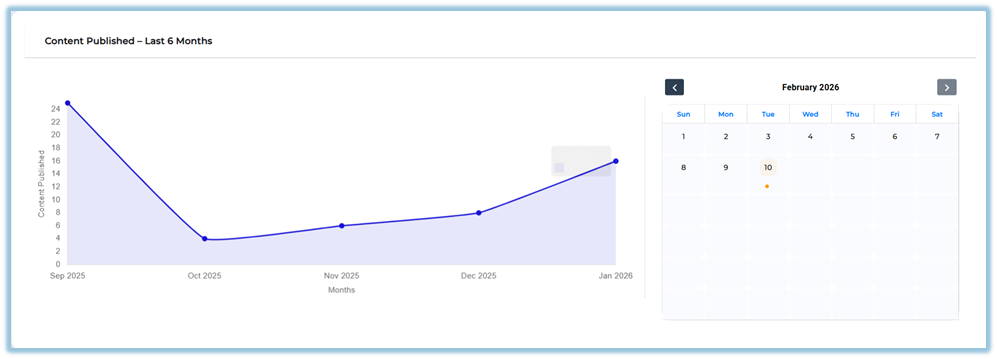
Content Published – Last 6 Months – Shows content publishing trends and calendar view.
-
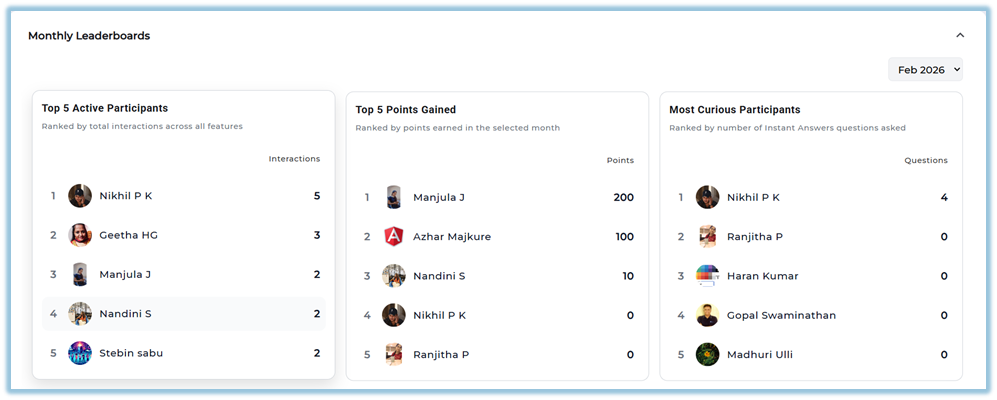
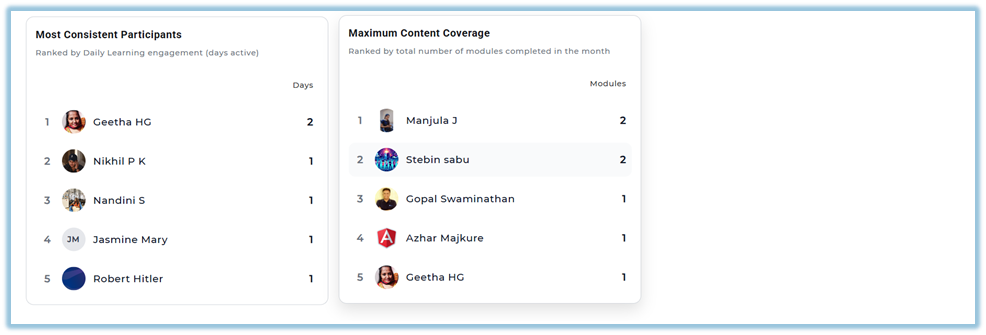
Monthly Leaderboards – Displays top participants based on different metrics.
4. Set Up Guide
-
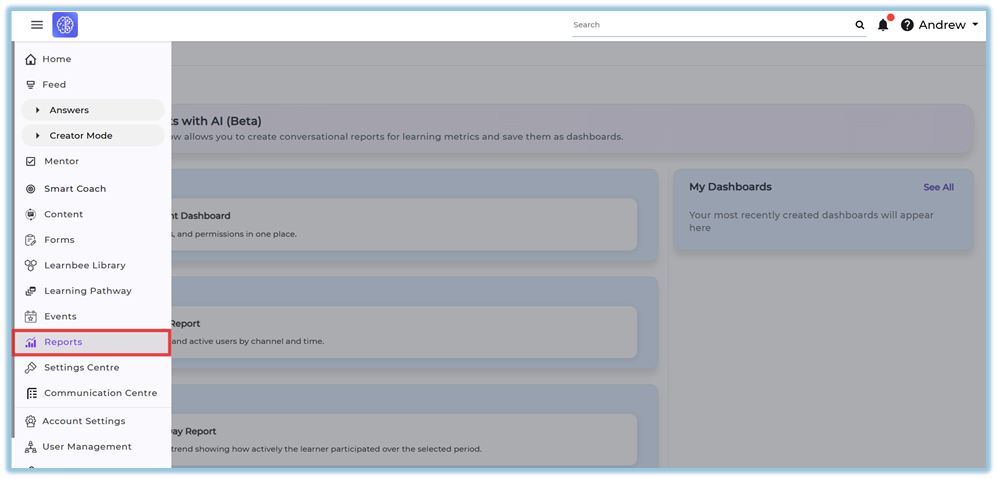
Click the three-line Menu from the homepage.
-
Click Reports.
-
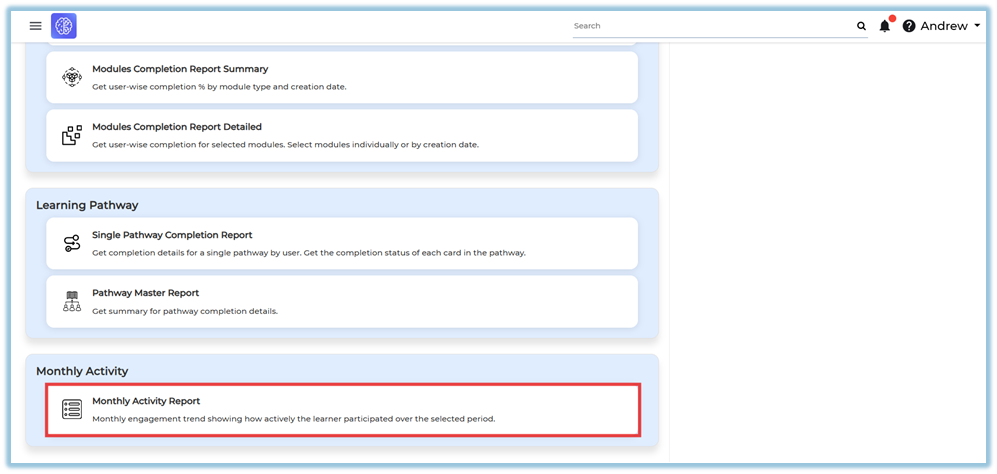
Select Monthly Activity Report.
-
The report opens with two tabs: Company and Team.
-
Select the appropriate tab based on your access level.
-
Review the Active Users Trend section to see monthly active and inactive users.
-
Review the Feature Activity Heat Map to analyze usage intensity for:
-
Instant Answers
-
Daily Learning
-
Content
-
-
Scroll to Total Interactions Trend to view interaction breakdown across features.
-
Review the summary cards for:
-
Instant Answers
-
Daily Learning
-
Content
-
-
Scroll to Inactive Users Exploration to:
-
Select the month
-
Choose grouping criteria (e.g., State)
-
View distribution chart
-
View inactive users list
-
Use Download All Inactive Users if required.
-
-
Review Modules Completion to compare Active Users and Modules Delivered.
-
Review Pathways Completion to track pathway activity trends.
-
Review Instant Answers Activity to analyze queries and active users.
-
Review Learning of the Day Participation for participation trends.
-
Review Content Published – Last 6 Months and use the calendar view to identify publishing dates.
-
Scroll to Monthly Leaderboards to view:
-
Top 5 Active Participants
-
Top 5 Points Gained
-
Most Curious Participants
-
Most Consistent Participants
-
Maximum Content Coverage
-
5. User View
-
Admins can access the report under the Company tab, showing complete organizational data.
-
Managers, Trainers, and Coaches can access the report under the Team tab, showing only users mapped to them.
-
The report is presented entirely through visual dashboards including:
-
Bar charts
-
Line graphs
-
Heat maps
-
Summary metric cards
-
Pie charts
-
Calendar indicators
-
Leaderboard tables
-
6. Reporting
The Monthly Activity Report provides visual dashboards summarizing engagement trends.
-
Active Users Trend – Displays monthly comparison of active and inactive users.
-
Feature Activity Heat Map – Shows feature usage intensity across Instant Answers, Daily Learning, and Content.
-
Total Interactions Trend – Displays total completed interactions across features by month.
-
Inactive Users Exploration – Shows inactive user distribution and a detailed inactive users list.
-
Modules Completion – Displays active users and modules delivered over time.
-
Pathways Completion – Shows active users and pathways delivered trends.
-
Instant Answers Activity – Displays number of queries and active users.
-
Learning of the Day Participation – Shows user participation trends over time.
-
Content Published – Last 6 Months – Displays publishing trends with a calendar view.
-
Monthly Leaderboards – Displays top participants based on interactions, points, curiosity, consistency, and content coverage.
The report can be accessed from:
Menu → Reports → Monthly Activity Report
https://converse.bsharpcorp.com/celebrate/monthly_activity_report
Full report download is not available. Export options may be available within specific sections.
7. Best Practices
-
Review multiple sections together for better insight correlation.
-
Monitor inactive users regularly for follow-up actions.
-
Use leaderboard data for performance recognition.
-
Validate content publishing using the calendar indicators.
-
Compare feature usage patterns across months.
8. Related Links / FAQs
Q: What does the orange dot in the calendar indicate?
A: The orange dot indicates that content was created on that specific date.
Q: What is the difference between Company and Team tabs?
A: The Company tab shows organization-wide data. The Team tab shows data limited to users mapped to the viewer.
9. Version Notes
Last Updated: 11 Feb 2026
No Comments